10Trade JournalPro
The Trade Journal is where you log every wheel trade you make — cash-secured puts, covered calls, and share positions. It tracks your profit and loss automatically and gives you a clear picture of how your account is performing.
Setting up your account
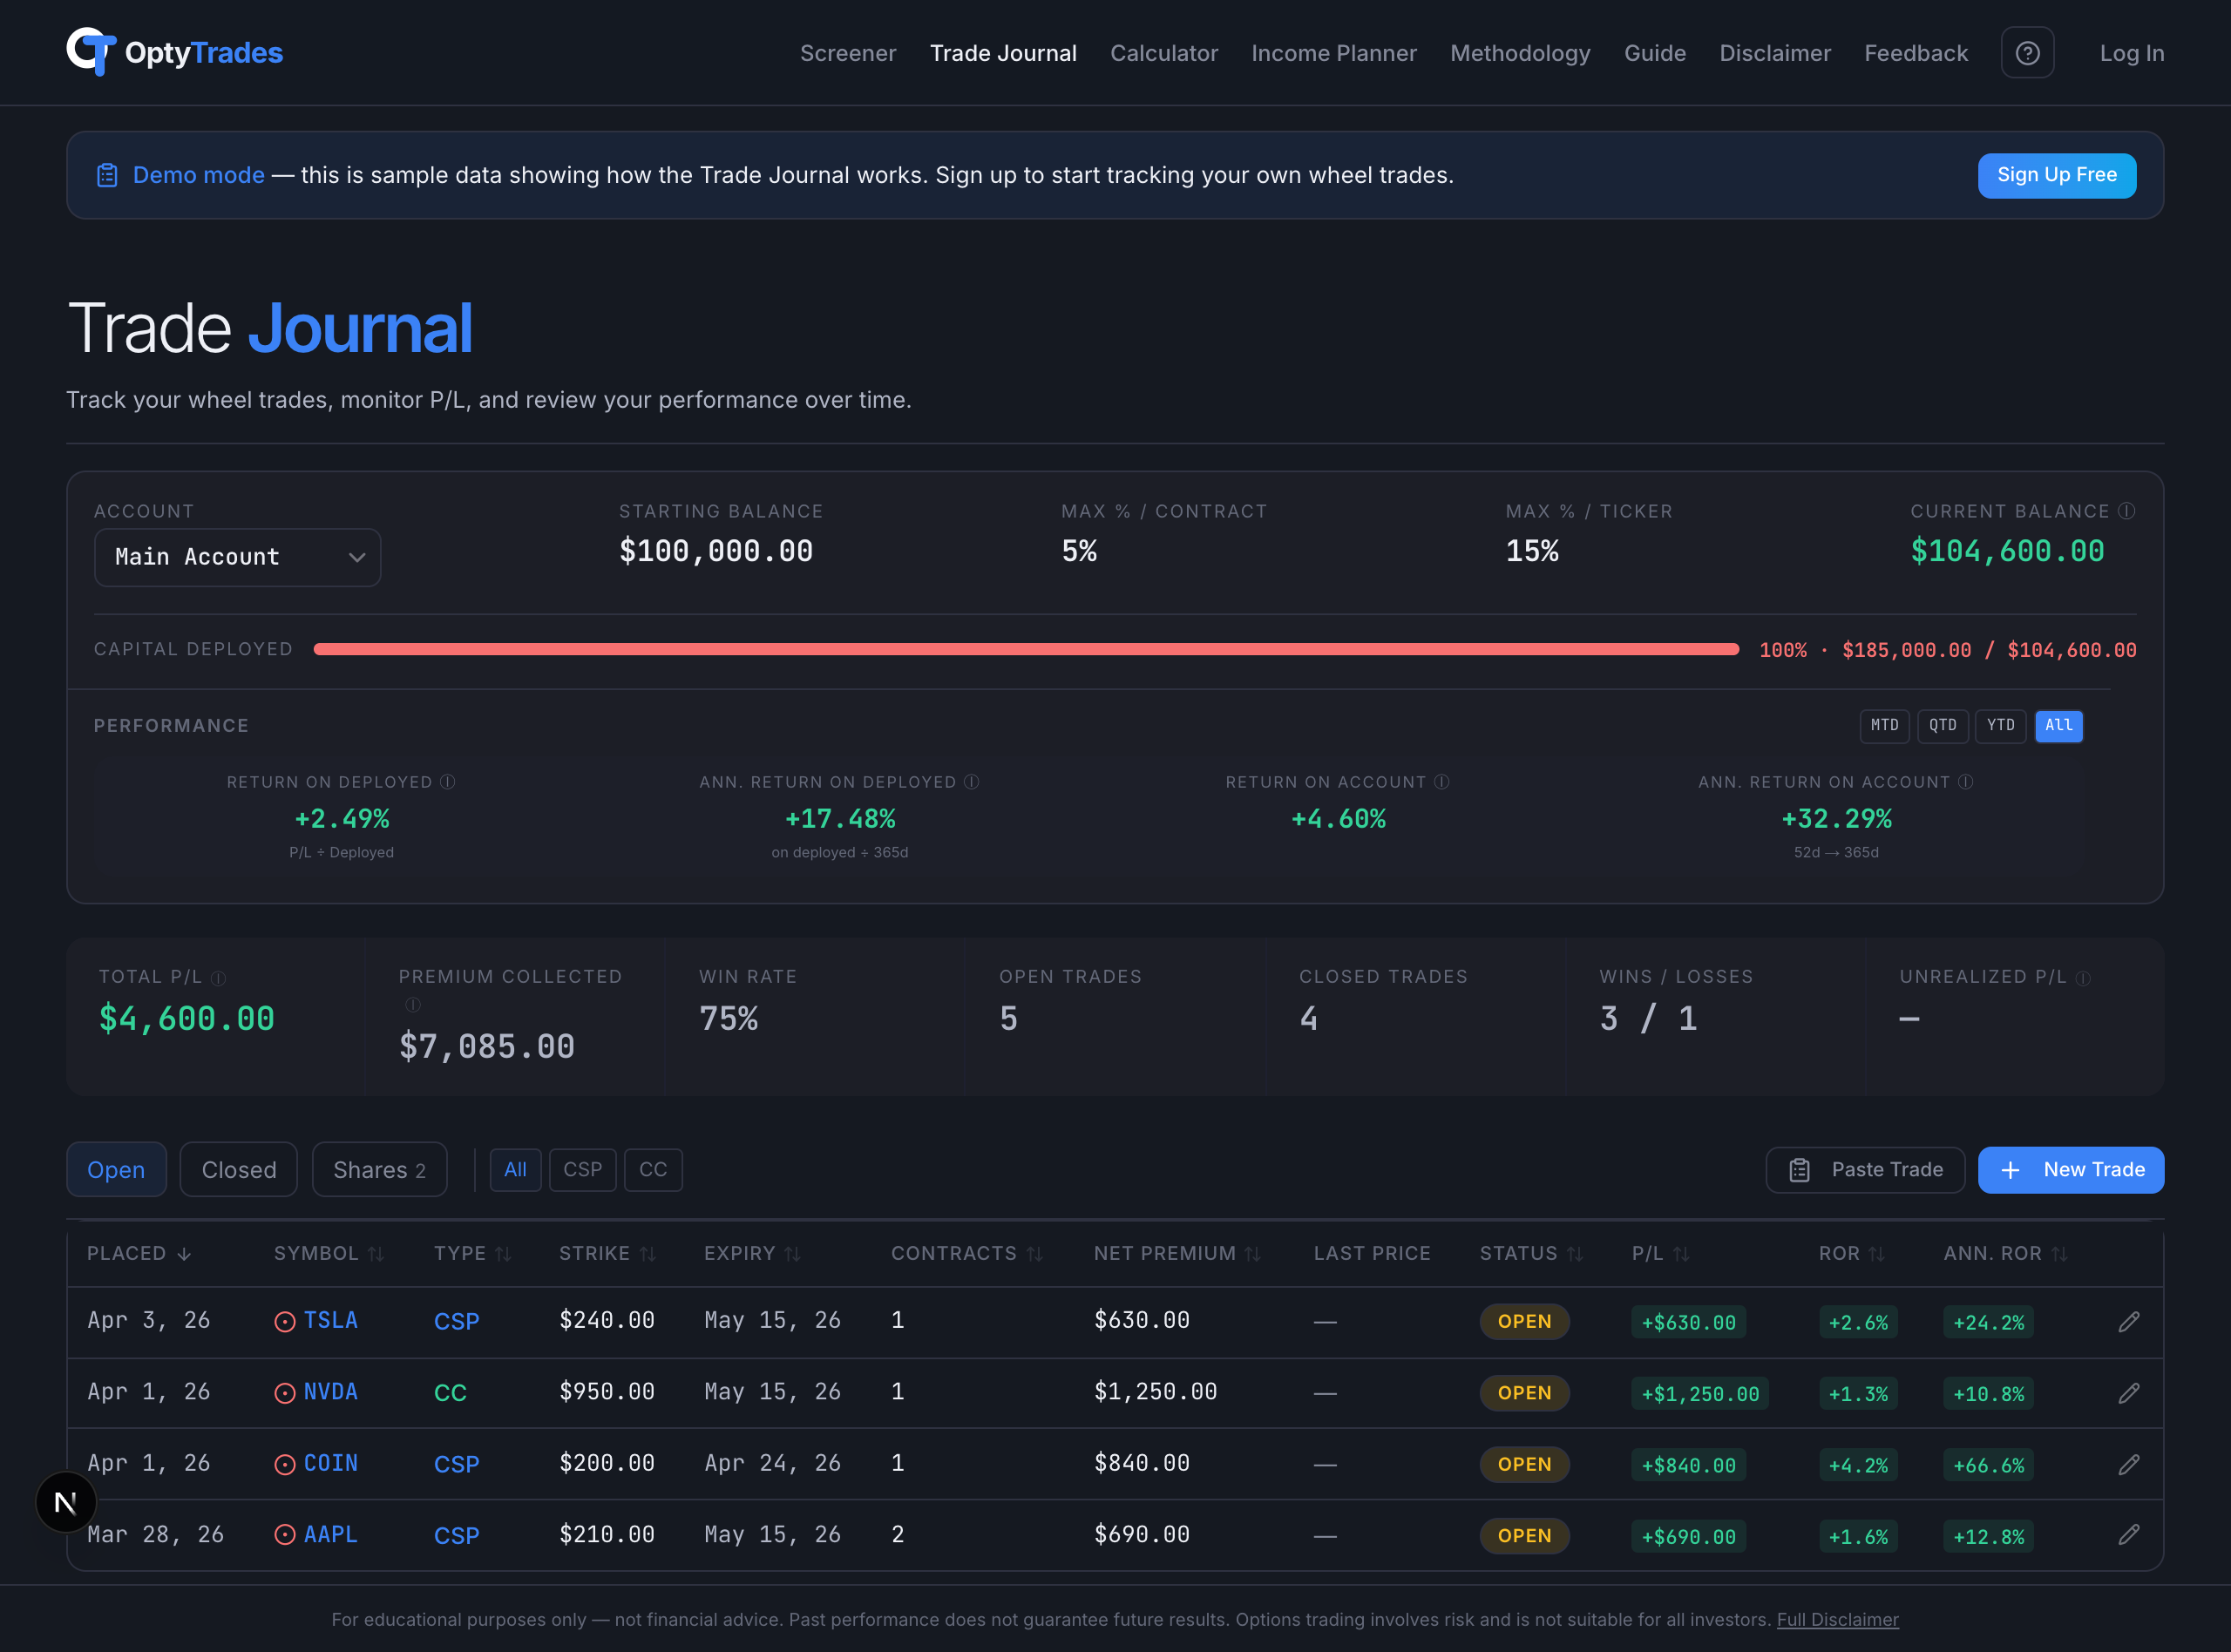
Before you start logging trades, set up your trading account. Click Set Balance and enter your starting balance (for example, $100,000). This is the amount of cash in your brokerage account.
The account bar shows you five things at a glance:
- Starting Balance — the amount you entered. Click Edit to change it anytime.
- Max % / Contract & Max % / Ticker — position sizing limits. These control the traffic light system (see Section 11).
- Current Balance — your starting balance plus your total P/L. Green means you're up, red means you're down.
- Capital Deployed — a progress bar showing how much of your account is committed to open positions. Green = under 50%, yellow = 50–75%, red = over 75%.
Below the bar you'll see performance metrics with period buttons (MTD, QTD, YTD, All) so you can see returns over different time frames.
Adding your first trade
Click + New Trade and choose your trade type. The form adapts based on what you're entering:
- Cash-Secured Put (CSP) — Enter the symbol, strike price, premium received (per share), number of contracts, fees, and expiration date.
- Covered Call (CC) — Same fields as a CSP, plus a Cover with shares dropdown to link to an existing stock position. When you link a CC, the shares automatically change to “Covered” status.
- Shares — Enter the symbol, buy price, number of shares, and (optionally) a sell price if you've already sold.
The Paste Trade shortcut
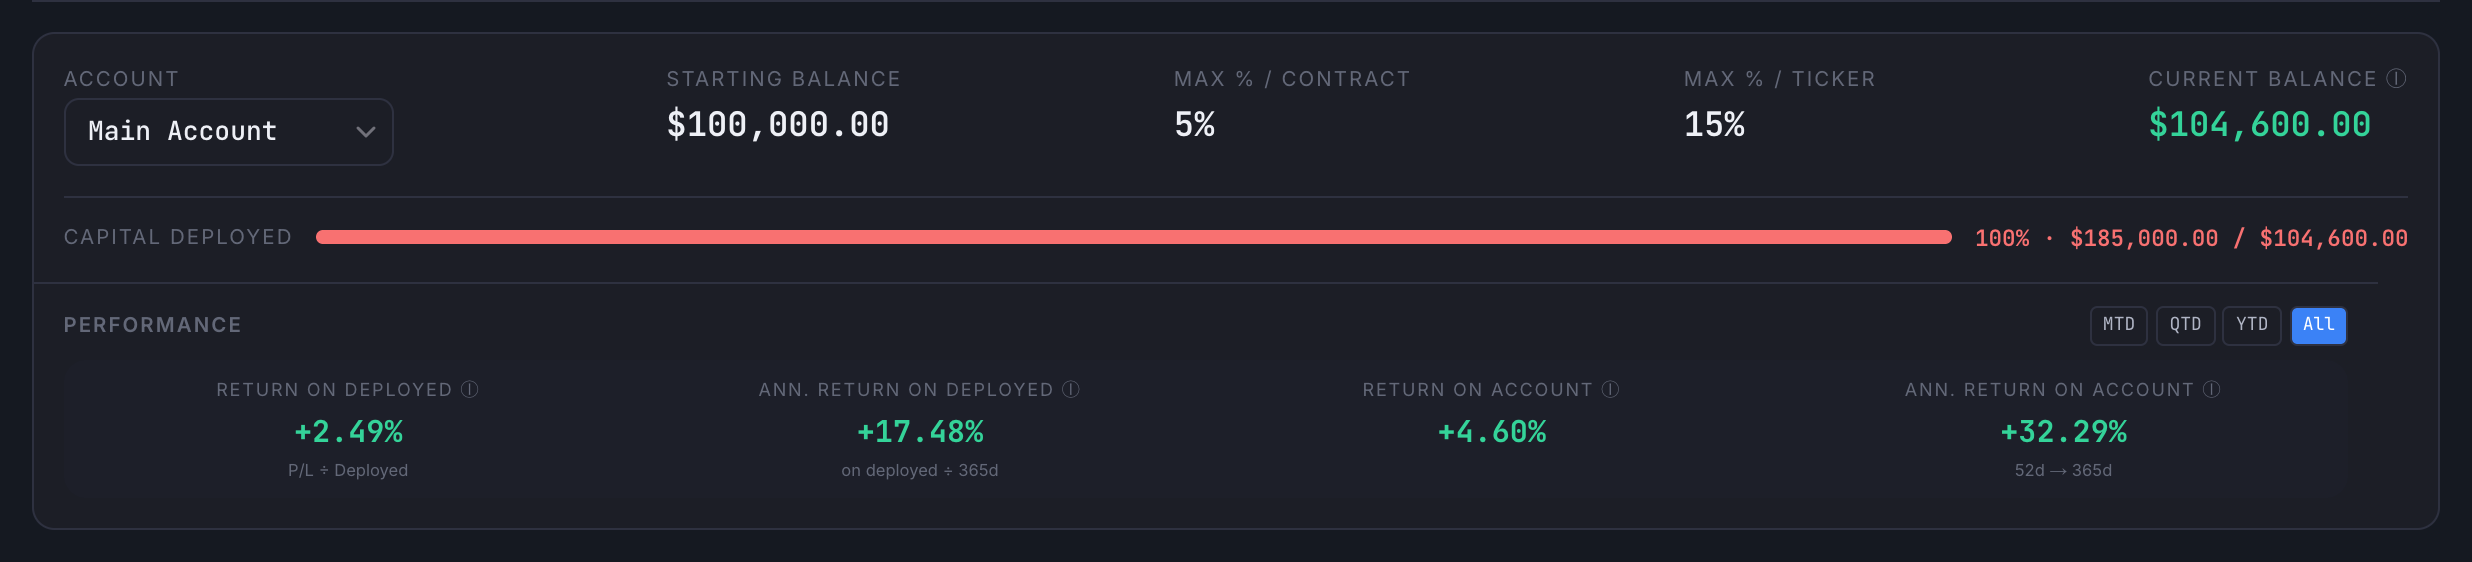
Don't want to type every field? Click Paste Trade to import directly from your broker. Copy your trade confirmation from thinkorswim or Schwab, paste it into the text box, and the Trade Journal parses everything automatically.
- One line — pre-fills the form so you can review and save.
- Multiple lines — batch-imports all trades at once.
- “TO CLOSE” lines — automatically finds your open trade by symbol, type, and strike, and records a Buy-to-Close.
Understanding the summary cards

The cards show your key performance numbers:
- Total P/L — your combined profit or loss across all trades. Green means profit, red means loss. The label and value flip to Realized P/L when you switch the Earned mode toggle (see below). A subline always shows the opposite-mode value so you see both numbers in context.
- Premium Collected — total option premium you've earned from selling puts and calls, after fees. Cash-basis — includes credits sitting on still-open contracts.
- Win Rate — percentage of closed trades that made money.
- Open / Closed Trades — how many positions are active vs. finished.
- Wins / Losses — count of profitable vs. unprofitable closed trades.
- Unrealized P/L — paper profit or loss on stock positions you still own, based on the latest closing price.
Earned mode: Collected vs. Realized
A Collected | Realized toggle sits above the summary cards. It changes how premium income is counted across the entire page — the Total P/L card, the Performance percentages, and the Income Breakdown table all flip together so the numbers can never disagree.
- Collected (default) — cash basis. Every STO credit is counted on the day you sold-to-open, and every BTC debit is counted on the day you bought-to-close. This matches how cash actually moved through your brokerage. It includes premium sitting on still-open contracts that could still go against you.
- Realized — conservative. Only counts premium once a contract has fully resolved (expired, BTC'd, assigned, or called away). The number you see is money you get to keep no matter what happens next.
When in Realized mode, the Performance section shows a small amber realized basis chip so you know you're looking at the conservative view. Annualized return cards gracefully show “—” when there are fewer than 5 closed trades, since annualizing a tiny realized sample produces wildly misleading numbers.
Income Breakdown
Below the summary cards, click Income Breakdown to expand a monthly premium tracker. It shows your premium cash flow, contract count, and win rate broken down by month, with quarterly and annual subtotals.
The Earned mode toggle controls what each month's number means:
- Collected — the actual cash that hit your account that month. STO credits show on the open date, BTC debits show on the close date, so a single contract can contribute to two different months.
- Realized — net P/L per contract, booked entirely on the contract's close date.
When you're in Collected mode and have open contracts, an amber line shows above the table: “⚠ $X,XXX.XX of unresolved premium in N open positions” — that's how much of the collected total could still flip to losses if the market moves against you.
Click any month row to expand it. Each individual cash-flow event becomes its own row:
- Ticker — on a closing-leg row (BTC/Resolved) the ticker is clickable; clicking it scrolls to and pulses the originating STO row so you can see where the contract started.
- Opened — the date the contract was sold-to-open. Useful for spotting that all of January's STOs share the same March expiry.
- Expires — the contract's original expiration date. For resolved contracts this is the date it was originally sold for, not when it actually closed.
- Event badge — STO (green: credit collected), BTC (amber: debit paid to close), or Resolved (gray: expired worthless / assigned / called away, $0 cash flow). On closing-leg rows a small relative-time pill (e.g.
←5w) shows how long ago the contract was opened. - Cash flow — how much this single event added to or removed from your account this month, not the contract's lifetime P/L. All event rows in an expanded month sum to the month total.
- Status — the contract's current lifecycle state. On an STO row this status may refer to a close that happened in a later month.
Position Health
Below Income Breakdown, click Position Health to expand a live cushion table for all your open CSP and CC positions. It uses real-time prices to show how much buffer you have before each contract goes in-the-money.
- CSP cushion — how far the stock price is above your strike. A positive % means you're still out-of-the-money; negative means you're ITM and the put is in danger of assignment.
- CC cushion — how far your strike is above the current price. Positive means the call is OTM; negative means the stock is above your strike and the shares could be called away.
Each row shows a coloured status badge:
- ITM — the contract is already in-the-money. For CSPs this means the stock has fallen below your strike; for CCs the stock is above your strike.
- Warn — buffer is thin but still OTM. CSPs show Warn below 3% cushion; CCs below 5%.
- OK — comfortable margin, no immediate risk.
Rows are sorted by risk: ITM positions first, then Warn, then OK. Within each tier the position with the smallest cushion appears at the top.
When at least one position is ITM or in the Warn zone, the collapsed header shows an amber badge with a count (e.g. “2 need attention”) so you can spot trouble at a glance without expanding the section.
Position Health only appears when you have at least one open CSP or CC in the currently selected account. It reads from the same live price feed used by the rest of the journal page, so no extra data fetch is needed.
Filtering your trades
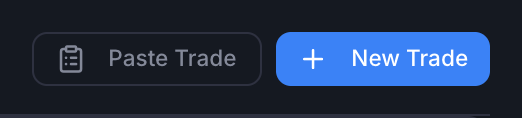
Use the filter buttons to see specific subsets of your trades:
- Open — all active positions (includes covered shares)
- Closed — expired, bought-to-close, assigned, or called-away trades
- Shares — just your stock positions
Within each main filter, you can narrow further — for example, under Closed you can filter by just CSPs or just CCs.
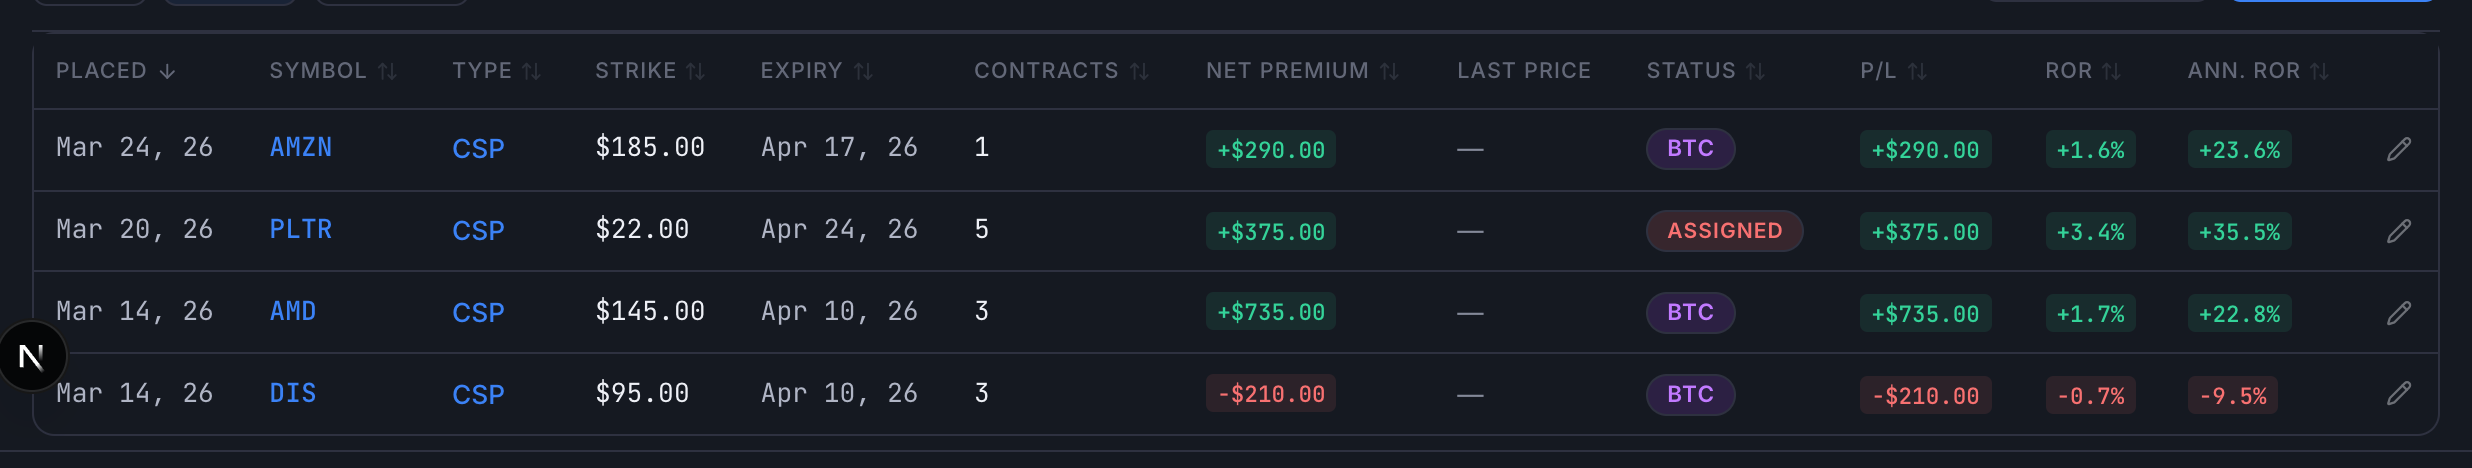
The trade table
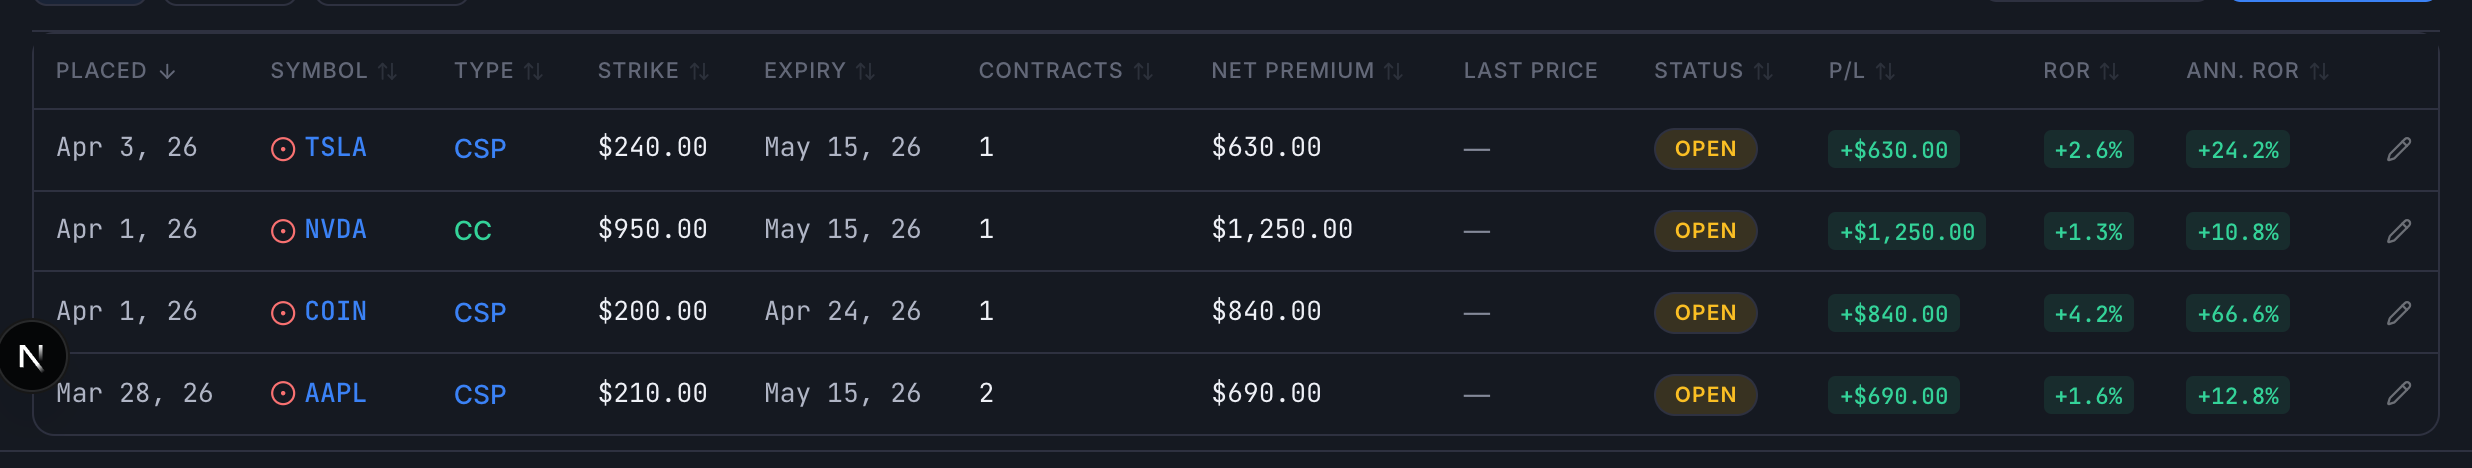
Each row in the table shows:
- Symbol — click to go to that stock's detail page. Open trades also show a colored dot for position sizing (green/yellow/red).
- Type — CSP, CC, or SHARES.
- Strike / Buy Price — the strike for options, or the price you paid for shares.
- Net Premium — for options, the premium collected minus any close cost and fees. Hover to see the full breakdown.
- P/L — profit or loss. Green badge for profit, red for loss.
- ROR / Ann. ROR — your rate of return and annualized return on this trade.
- Status — where the trade is in its lifecycle (see below).
- Actions — to edit, to duplicate (opens the Add Trade form pre-filled with the same details — useful for re-entering a similar position quickly), to delete.
Trade statuses explained
| Status | What it means |
|---|---|
| Open | The position is active — you're in the trade. |
| Covered | Shares only — you've sold a covered call against this position. Set automatically when you link a CC. |
| Expired | The option expired worthless — you keep the full premium. This is a win. |
| BTC | Buy-to-Close — you bought back the option before it expired. Your P/L is the premium collected minus the close cost. |
| Assigned | CSP only — you were assigned 100 shares per contract. A stock position is created automatically. Now sell covered calls against your shares. |
| Called Away | CC only — your shares were sold at the strike price. The linked stock position closes automatically. Now sell a new CSP to restart the wheel. |
Viewing closed trades
Click the Closed filter to see all your completed trades. Each one shows the final P/L and how it was closed (expired, BTC, assigned, or called away).
The full wheel cycle
The wheel strategy follows a repeatable cycle, and the Trade Journal tracks every step:
- Sell a CSP — log it as a new CSP trade. Status: Open.
- It expires worthless — set status to Expired. You keep the premium. Start over with step 1.
- Or you get assigned — change the CSP status to Assigned. A SHARES position is created automatically at your strike price.
- Sell a covered call — add a new CC trade and link it to your shares. The shares status changes to Covered.
- CC expires worthless — the shares revert to Open. Sell another CC (repeat step 4).
- Shares called away — set the CC status to Called Away. The linked shares are closed. Back to step 1.
How P/L is calculated
- Options (CSP/CC) — P/L = (premium × 100 × contracts) − (close cost × 100 × contracts) − open fees − close fees.
- Shares — Realized P/L = (sell price − buy price) × shares − fees. While open, unrealized P/L is calculated from the latest closing price.
Connection to Income Planner
Everything you log in the Trade Journal flows into the Income Planner. When you enable Trade Journal Mode in the Income Planner, it pulls your real trades to calculate actual yield, account balance, and sustainability. If you withdraw money, your account balance adjusts — and the Income Planner recalculates whether your income plan is still on track.
See the Income Planner guide for the full details.
11Position Sizing & Risk ManagementPro
Good position sizing is what keeps one bad stock from ruining your whole account. The Trade Journal includes a built-in traffic light system that warns you when a single position — or your entire portfolio — is getting too concentrated.
How the traffic lights work
Once you set your account balance, every open trade gets a colored dot next to its symbol. The color reflects how much of your account that one stock uses across all your positions on it:
| Color | Threshold | What it means |
|---|---|---|
| Green | ≤ Max % / Contract | Healthy — one bad trade won't hurt your account significantly. |
| Yellow | Between contract and ticker max | Caution — getting concentrated on this stock. |
| Red | > Max % / Ticker | Overweight — a big drop in this stock could seriously damage your account. |
Capital deployed bar
The progress bar in the account bar shows how much of your total account is tied up in open positions:
- Green (≤ 50%) — plenty of cash for new opportunities or unexpected assignments.
- Yellow (50–75%) — getting tight. Be selective about opening new positions.
- Red (> 75%) — fully deployed. No room for dips or new setups.
Scale-in tracking
When you have multiple open CSPs on the same stock, colored dots appear next to the symbol showing your scale-in level. This helps you see how many layers deep you are:
- Level 1 — your initial entry
- Level 2 — stock dropped ~20%, you sold another CSP lower
- Level 3 — ~40% drop, another CSP (high-conviction only)
- Level 4 — maximum position. Beyond this, the stock may have fundamental problems.
Position sizing in the Calculator
The Options Calculator also uses your account size. When you analyze a potential trade, it shows:
- How much capital this trade would use and what % of your account
- Whether you already have positions on that ticker
- Your remaining buying power after the trade
- The scale-in level if you already have CSPs on that stock