01Getting started
OptyTrades helps you find stocks worth running the wheel strategy on — an options income approach built on selling cash-secured puts (CSPs) and covered calls (CCs) on companies you'd be content to own. If you're new to the wheel, our methodology page explains the mechanics in detail.
This walks through your first five minutes — from opening the screener to reading a full trade setup.
Prefer to watch? Real trades broken down start to finish, plus beginner walkthroughs of cash-secured puts and covered calls.
Quick-start: your first five minutes
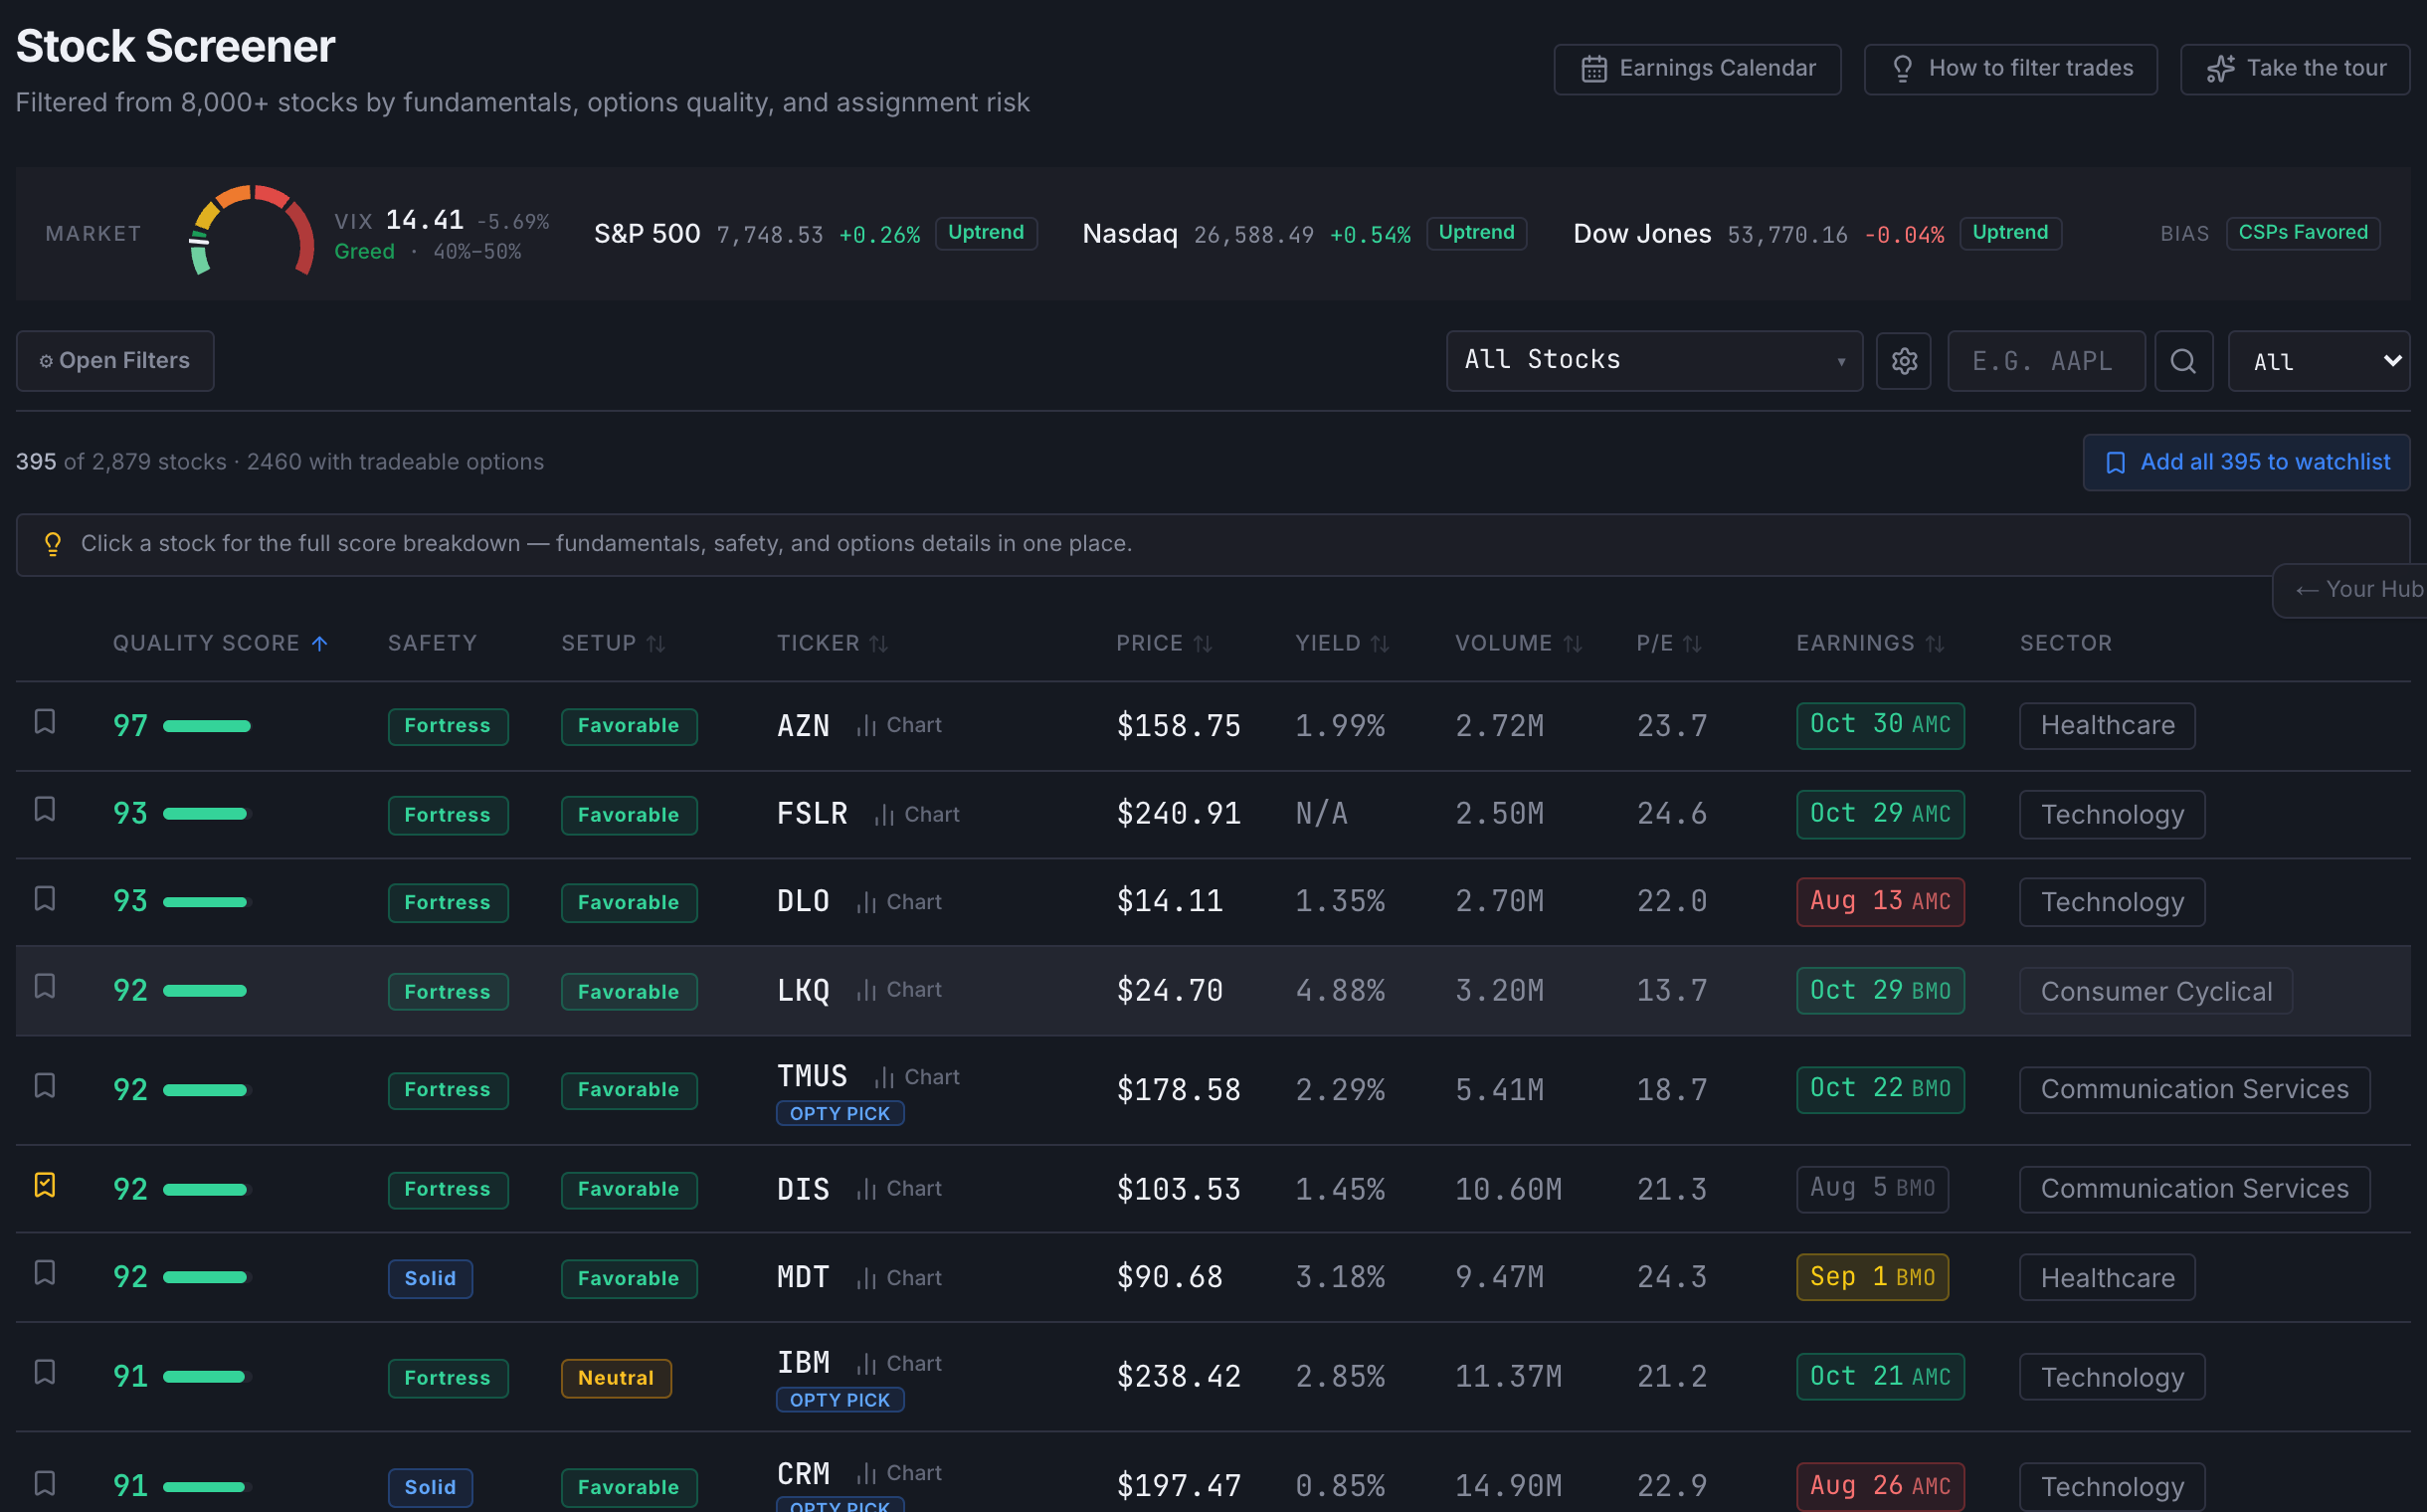
Head to the Screener. It starts from a universe of 8,000+ US stocks, filters on fundamentals, options quality and assignment risk, and ranks whatever survives by Quality Score. Nothing to configure — results are already there when the page loads, and every visit starts from the same clean slate.
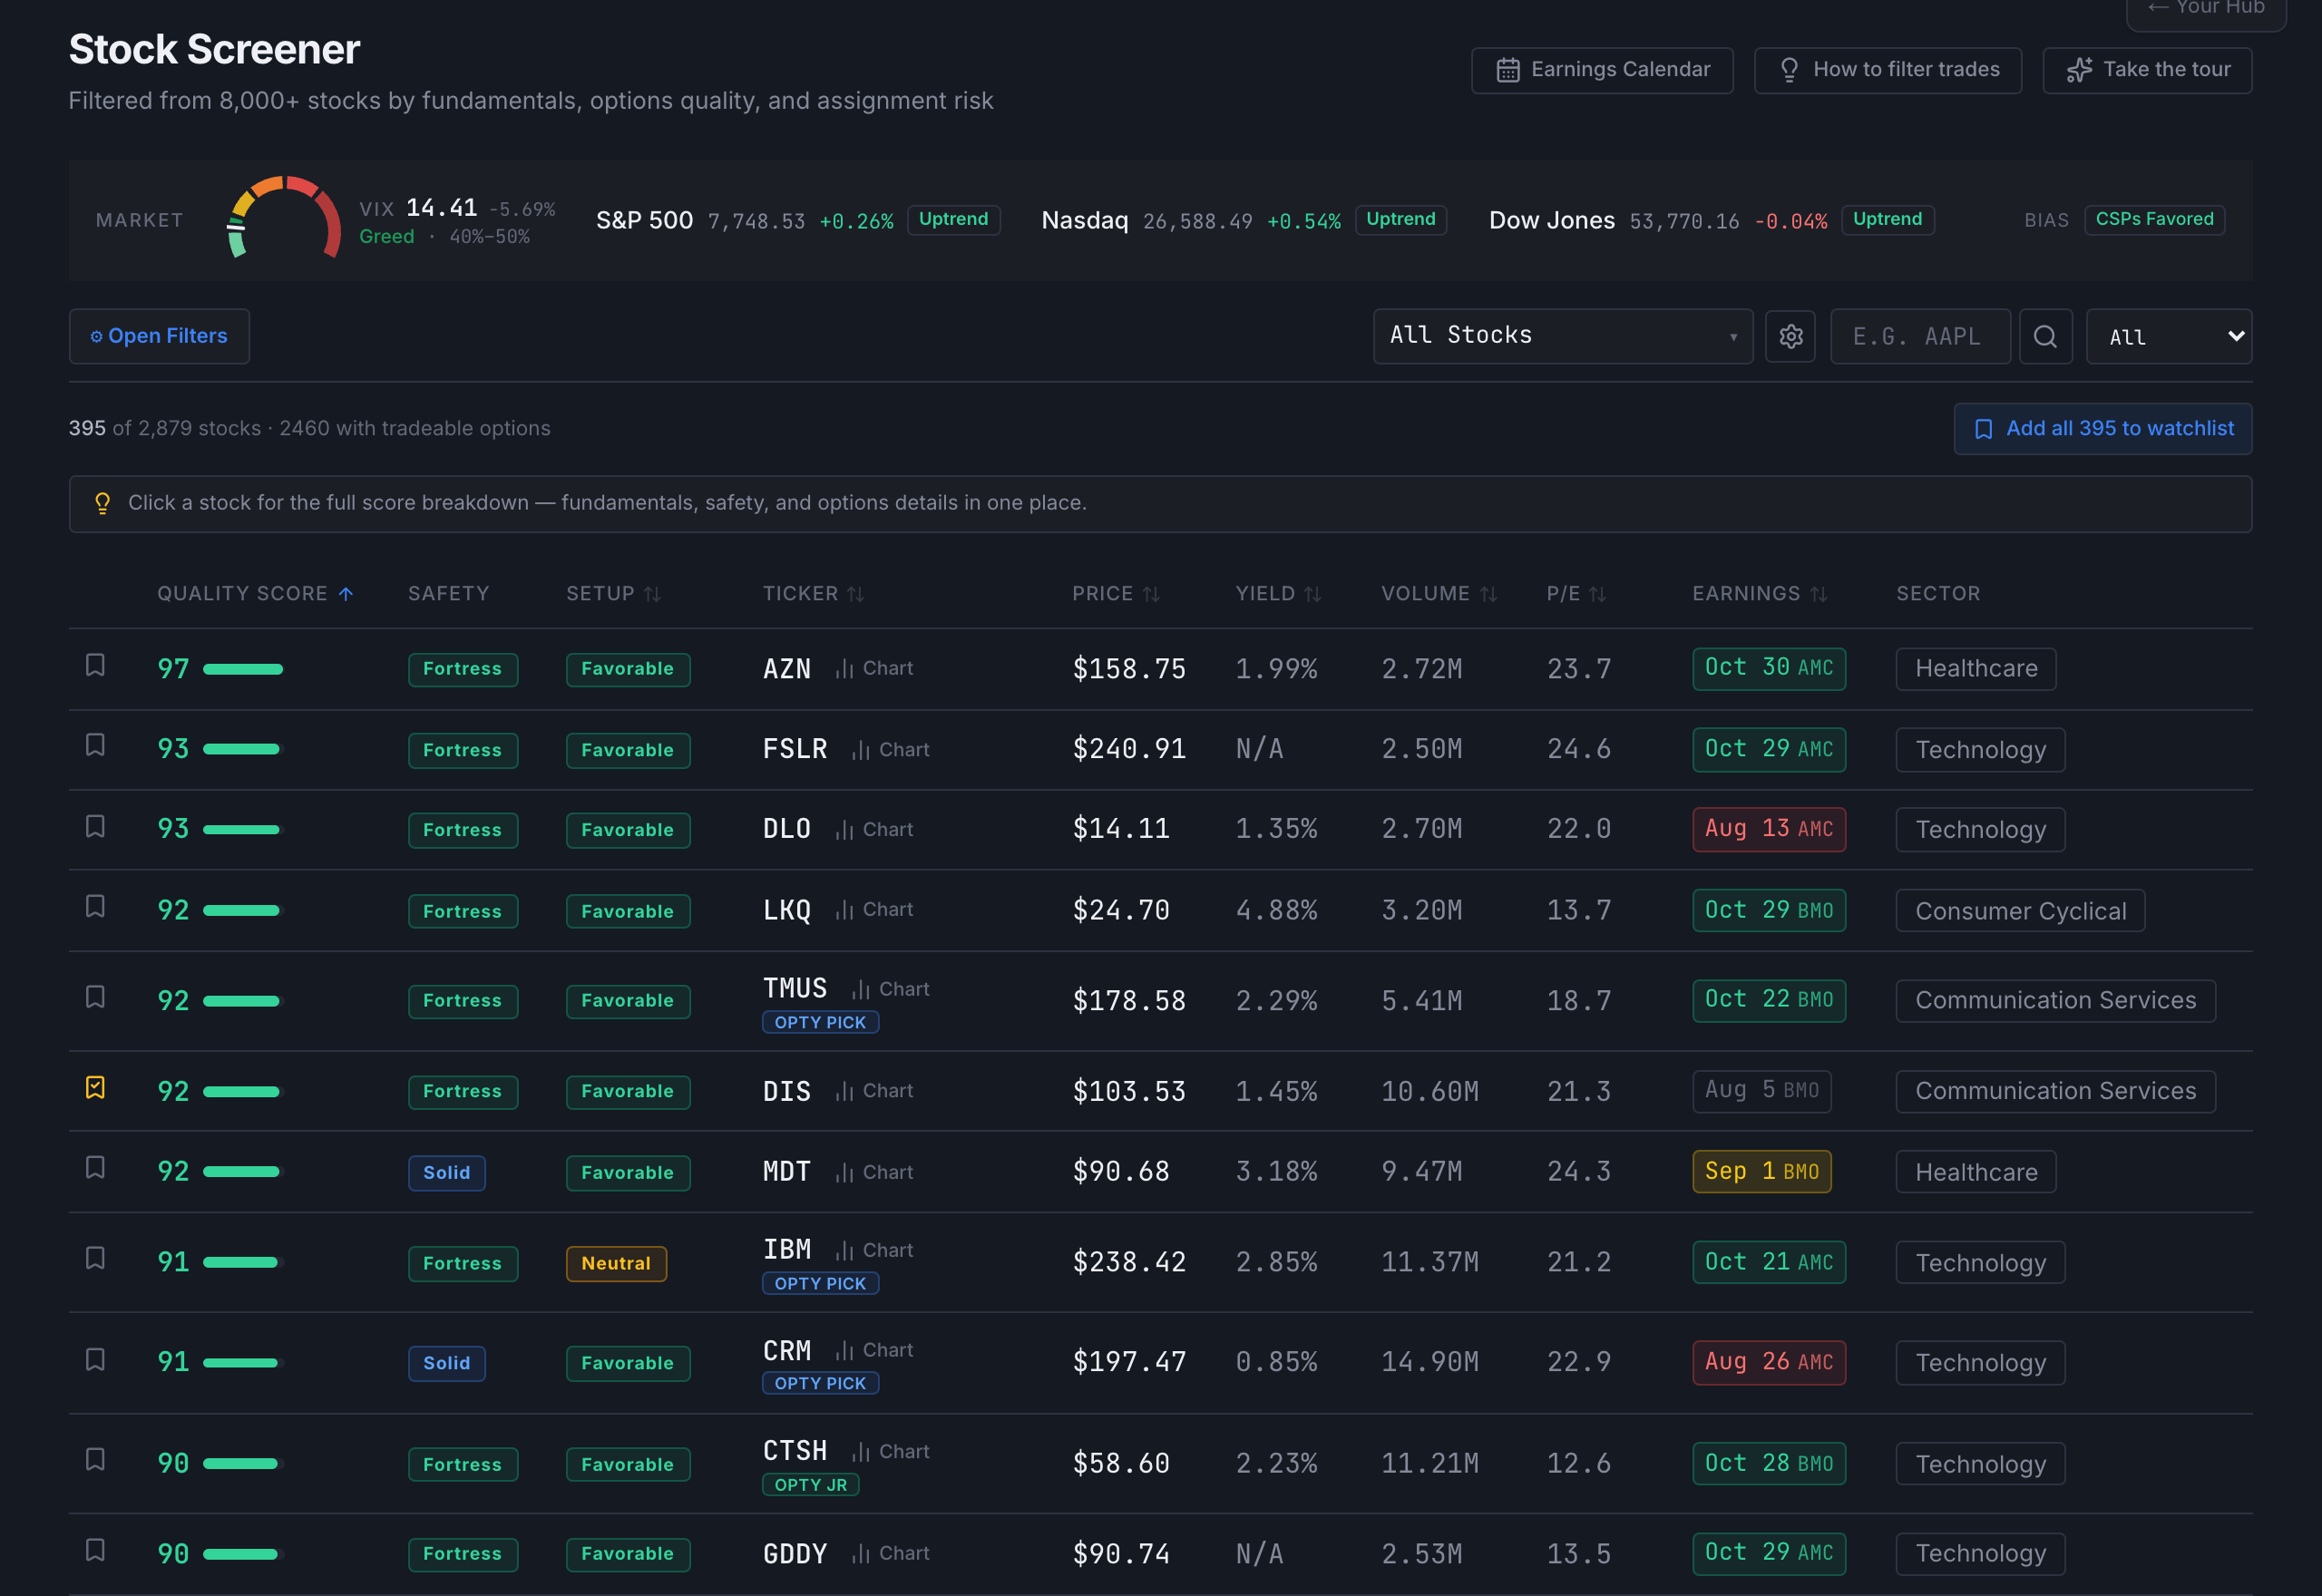
The three leading columns do most of the work. Quality Score (0–100) rates the company on fundamentals — is this a business worth owning? Safety is a balance-sheet badge: Fortress, Solid, Caution or Danger. Setup reads current conditions as Favorable, Neutral or Unfavorable. After those come the ticker, price, yield, volume, P/E, the next earnings date, and sector.
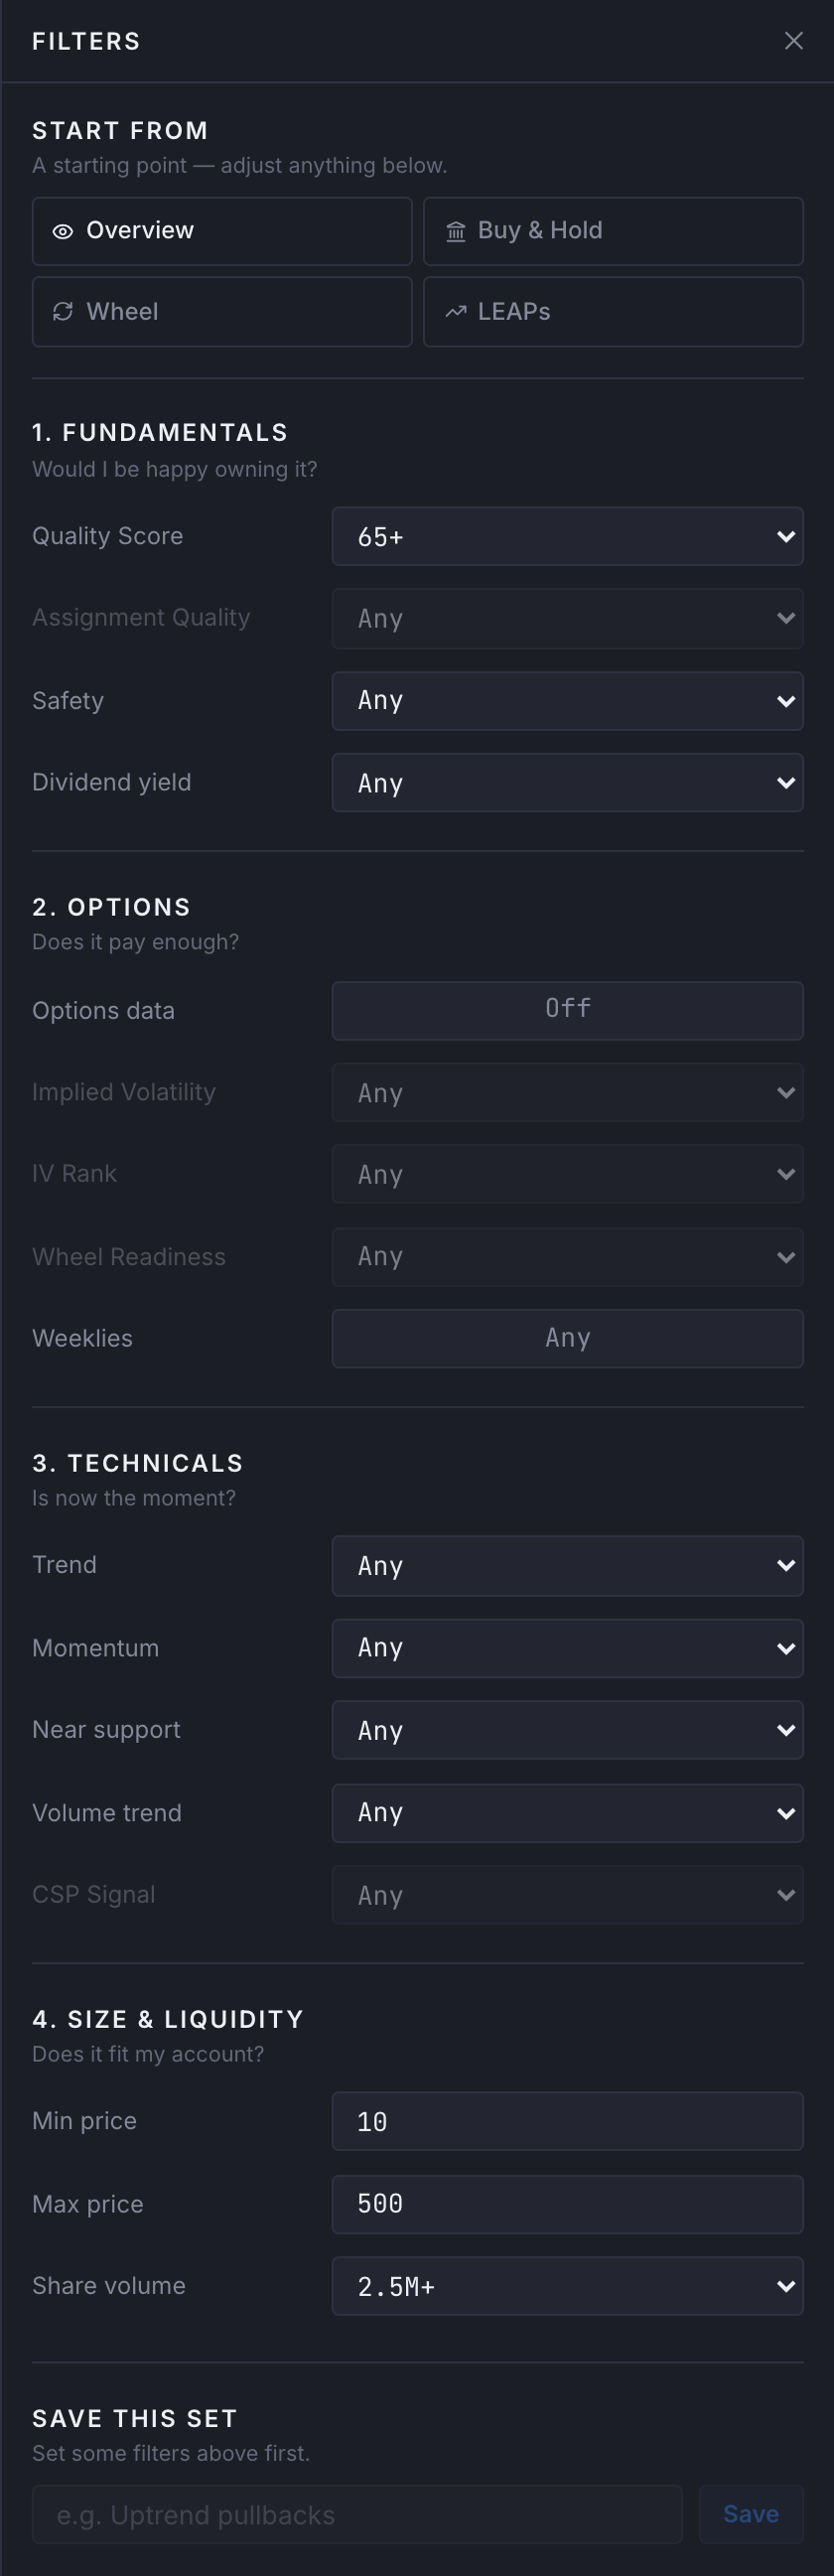
Everything that filters the list lives behind Open Filters at the top left. It opens a panel on the right with four groups — Fundamentals (would I be happy owning it?), Options (does it pay enough?), Technicals (is now the moment?) and Size & liquidity (does it fit my account?). Nothing needs applying: the table updates as you change a setting.
If you don't know where to begin, use Start from at the top of the panel. Picking Wheel sets a sensible quality floor, premium floor and liquidity floor in one go — then adjust anything you disagree with. Everything a strategy sets shows up as a removable chip beside the button, so a short list always explains itself.
Two things worth knowing early. Several filters — IV, IV Rank, Assignment Quality, Wheel Readiness and CSP Signal — need the Options data switch on, and say so when it isn't. And filters reset every visit by design, so a setting you forgot about can never quietly hide half the market. If you build a combination you like, Save this set at the bottom of the panel keeps it on your account.
Clicking a row expands it in place. You'll see the Quality Score out of 100 alongside every factor that produced it — profitability, P/E, earnings growth and trajectory, analyst consensus, 52-week position, beta, financial health, Piotroski F-Score, bankruptcy risk, Graham valuation, dividend sustainability, revenue and cash-flow health — each with its own points and a one-line explanation. This is where a score stops being a number and starts being a reason.
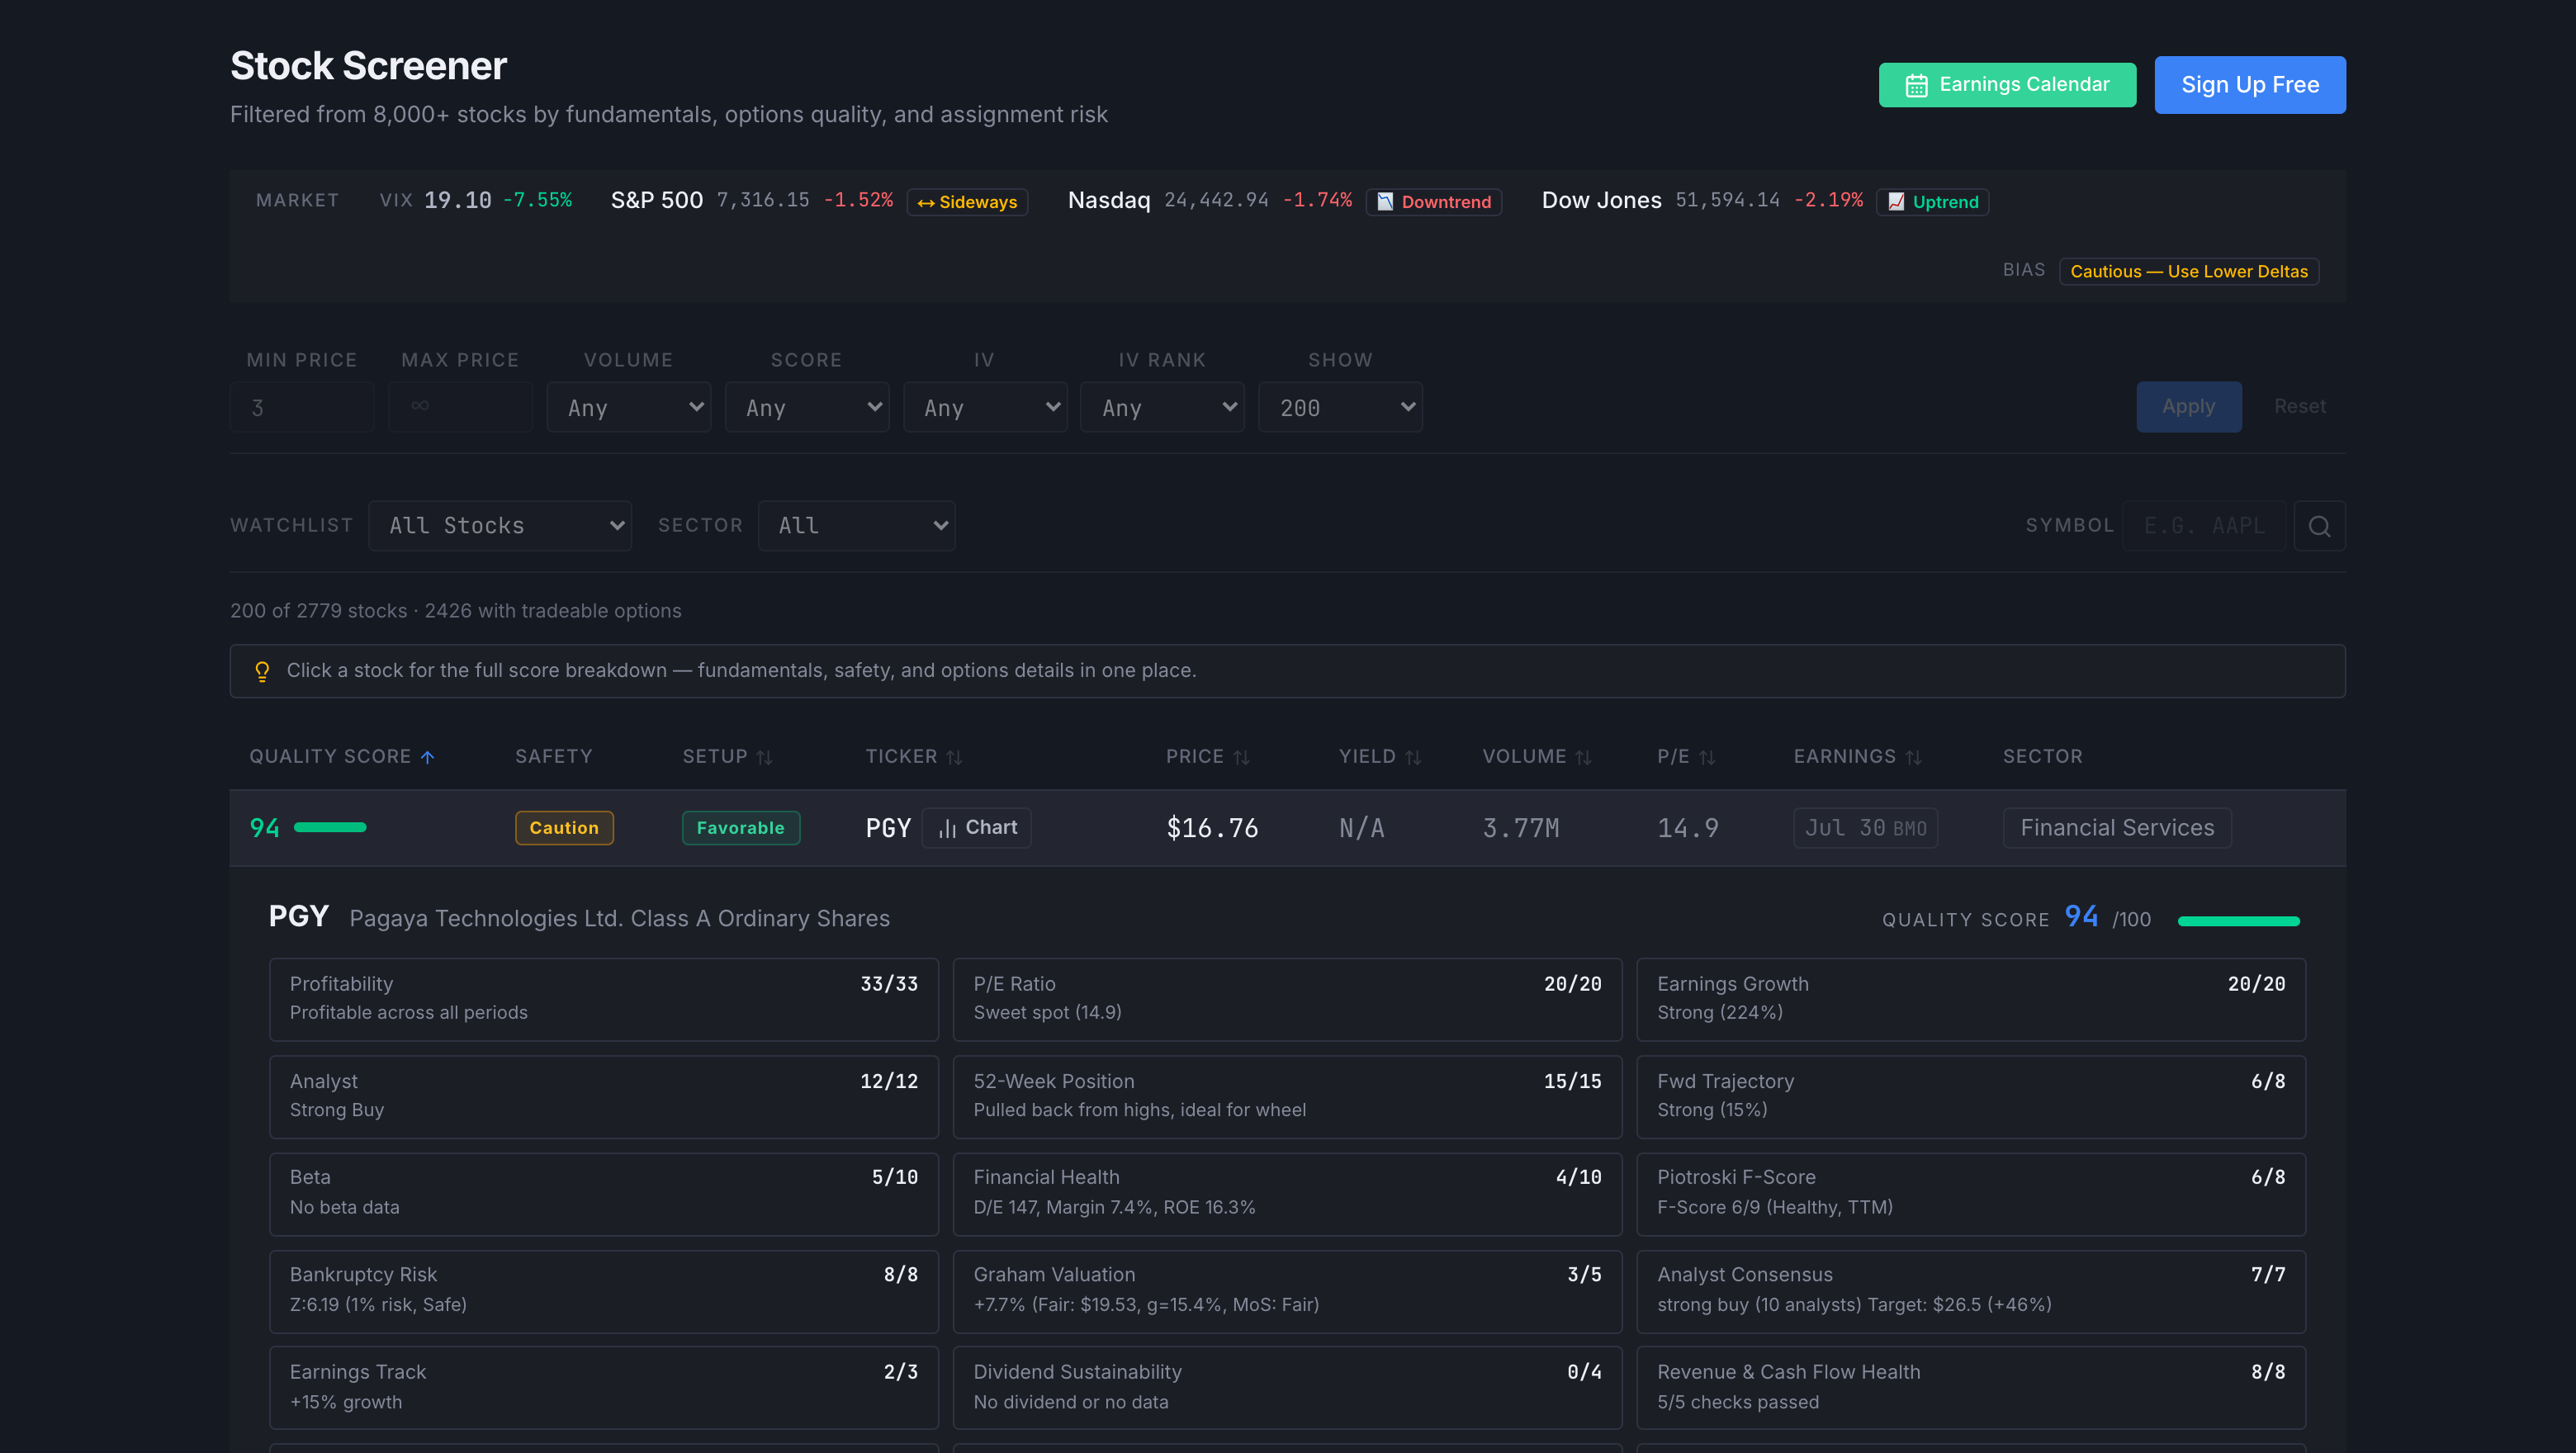
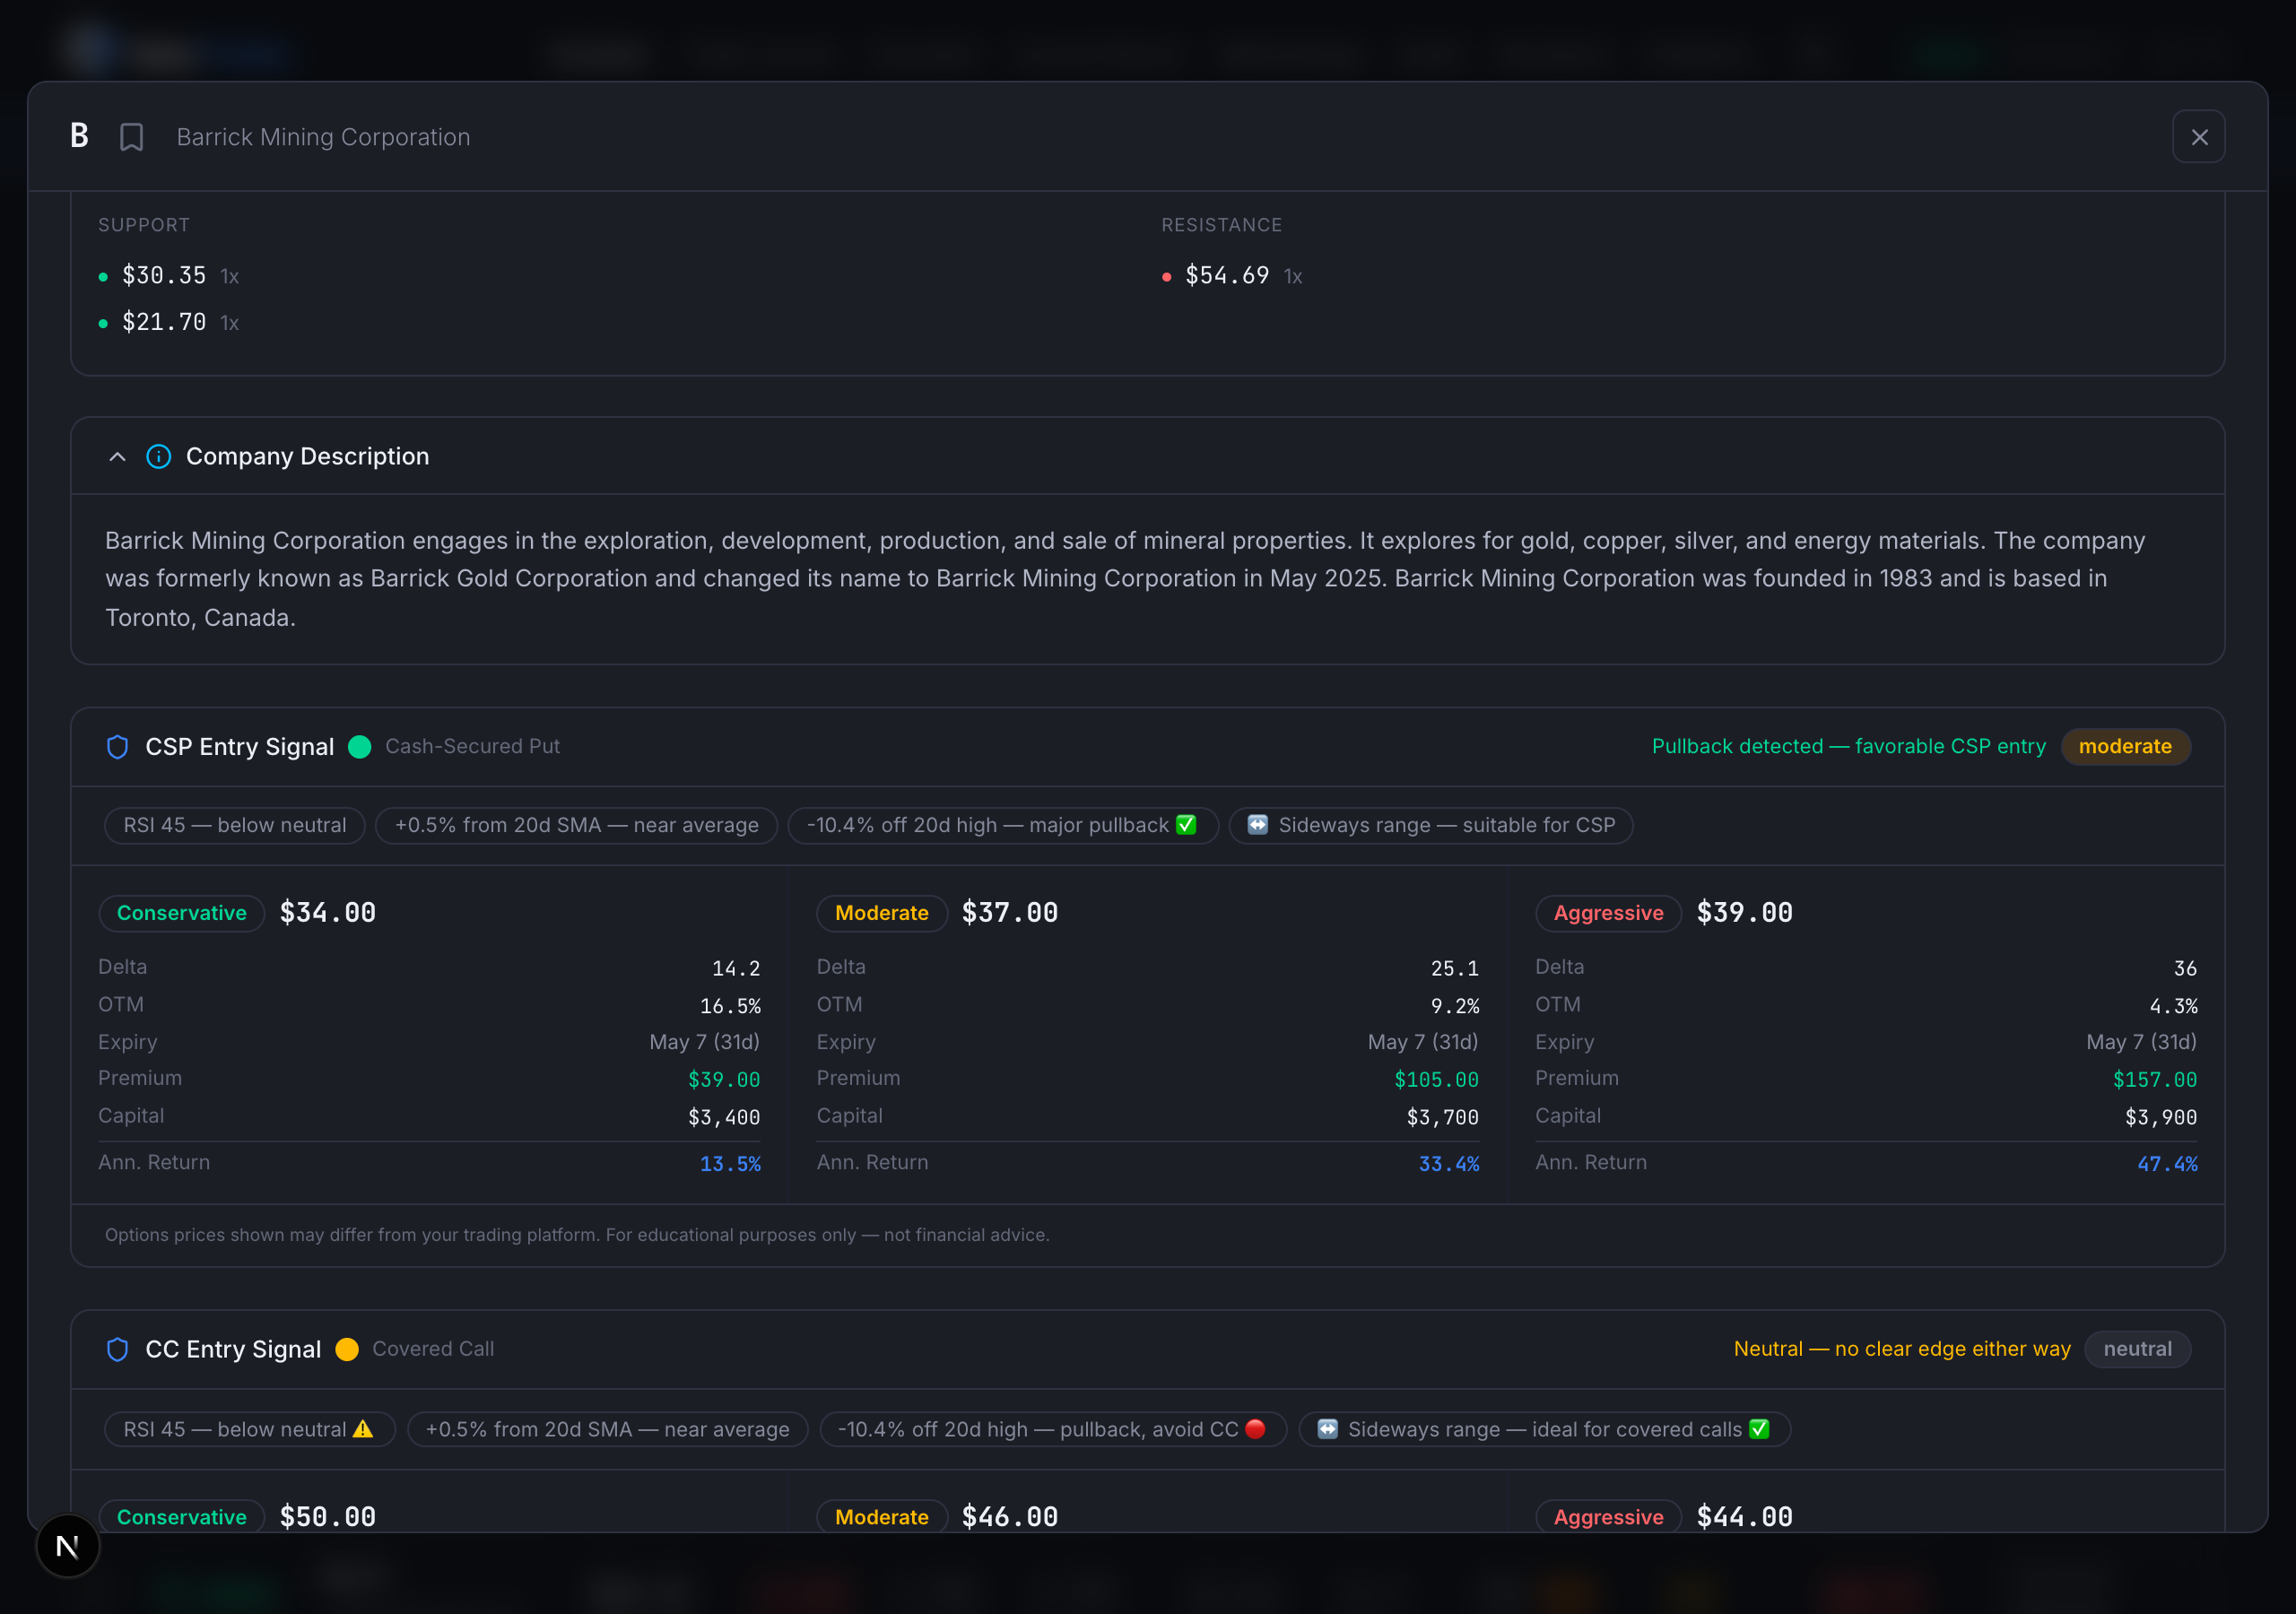
AAPL and clear it again to return to the list you were on.Further down the detail view are the CSP Entry Signal and CC Entry Signal cards. Each reports a verdict — Favorable, Neutral or Unfavorable — describing how aligned conditions are right now, and lists the specific reasons behind it: RSI, distance from the 20-day moving average, whether the stock has pulled back, and so on. The verdict describes conditions; it is not an instruction to trade.
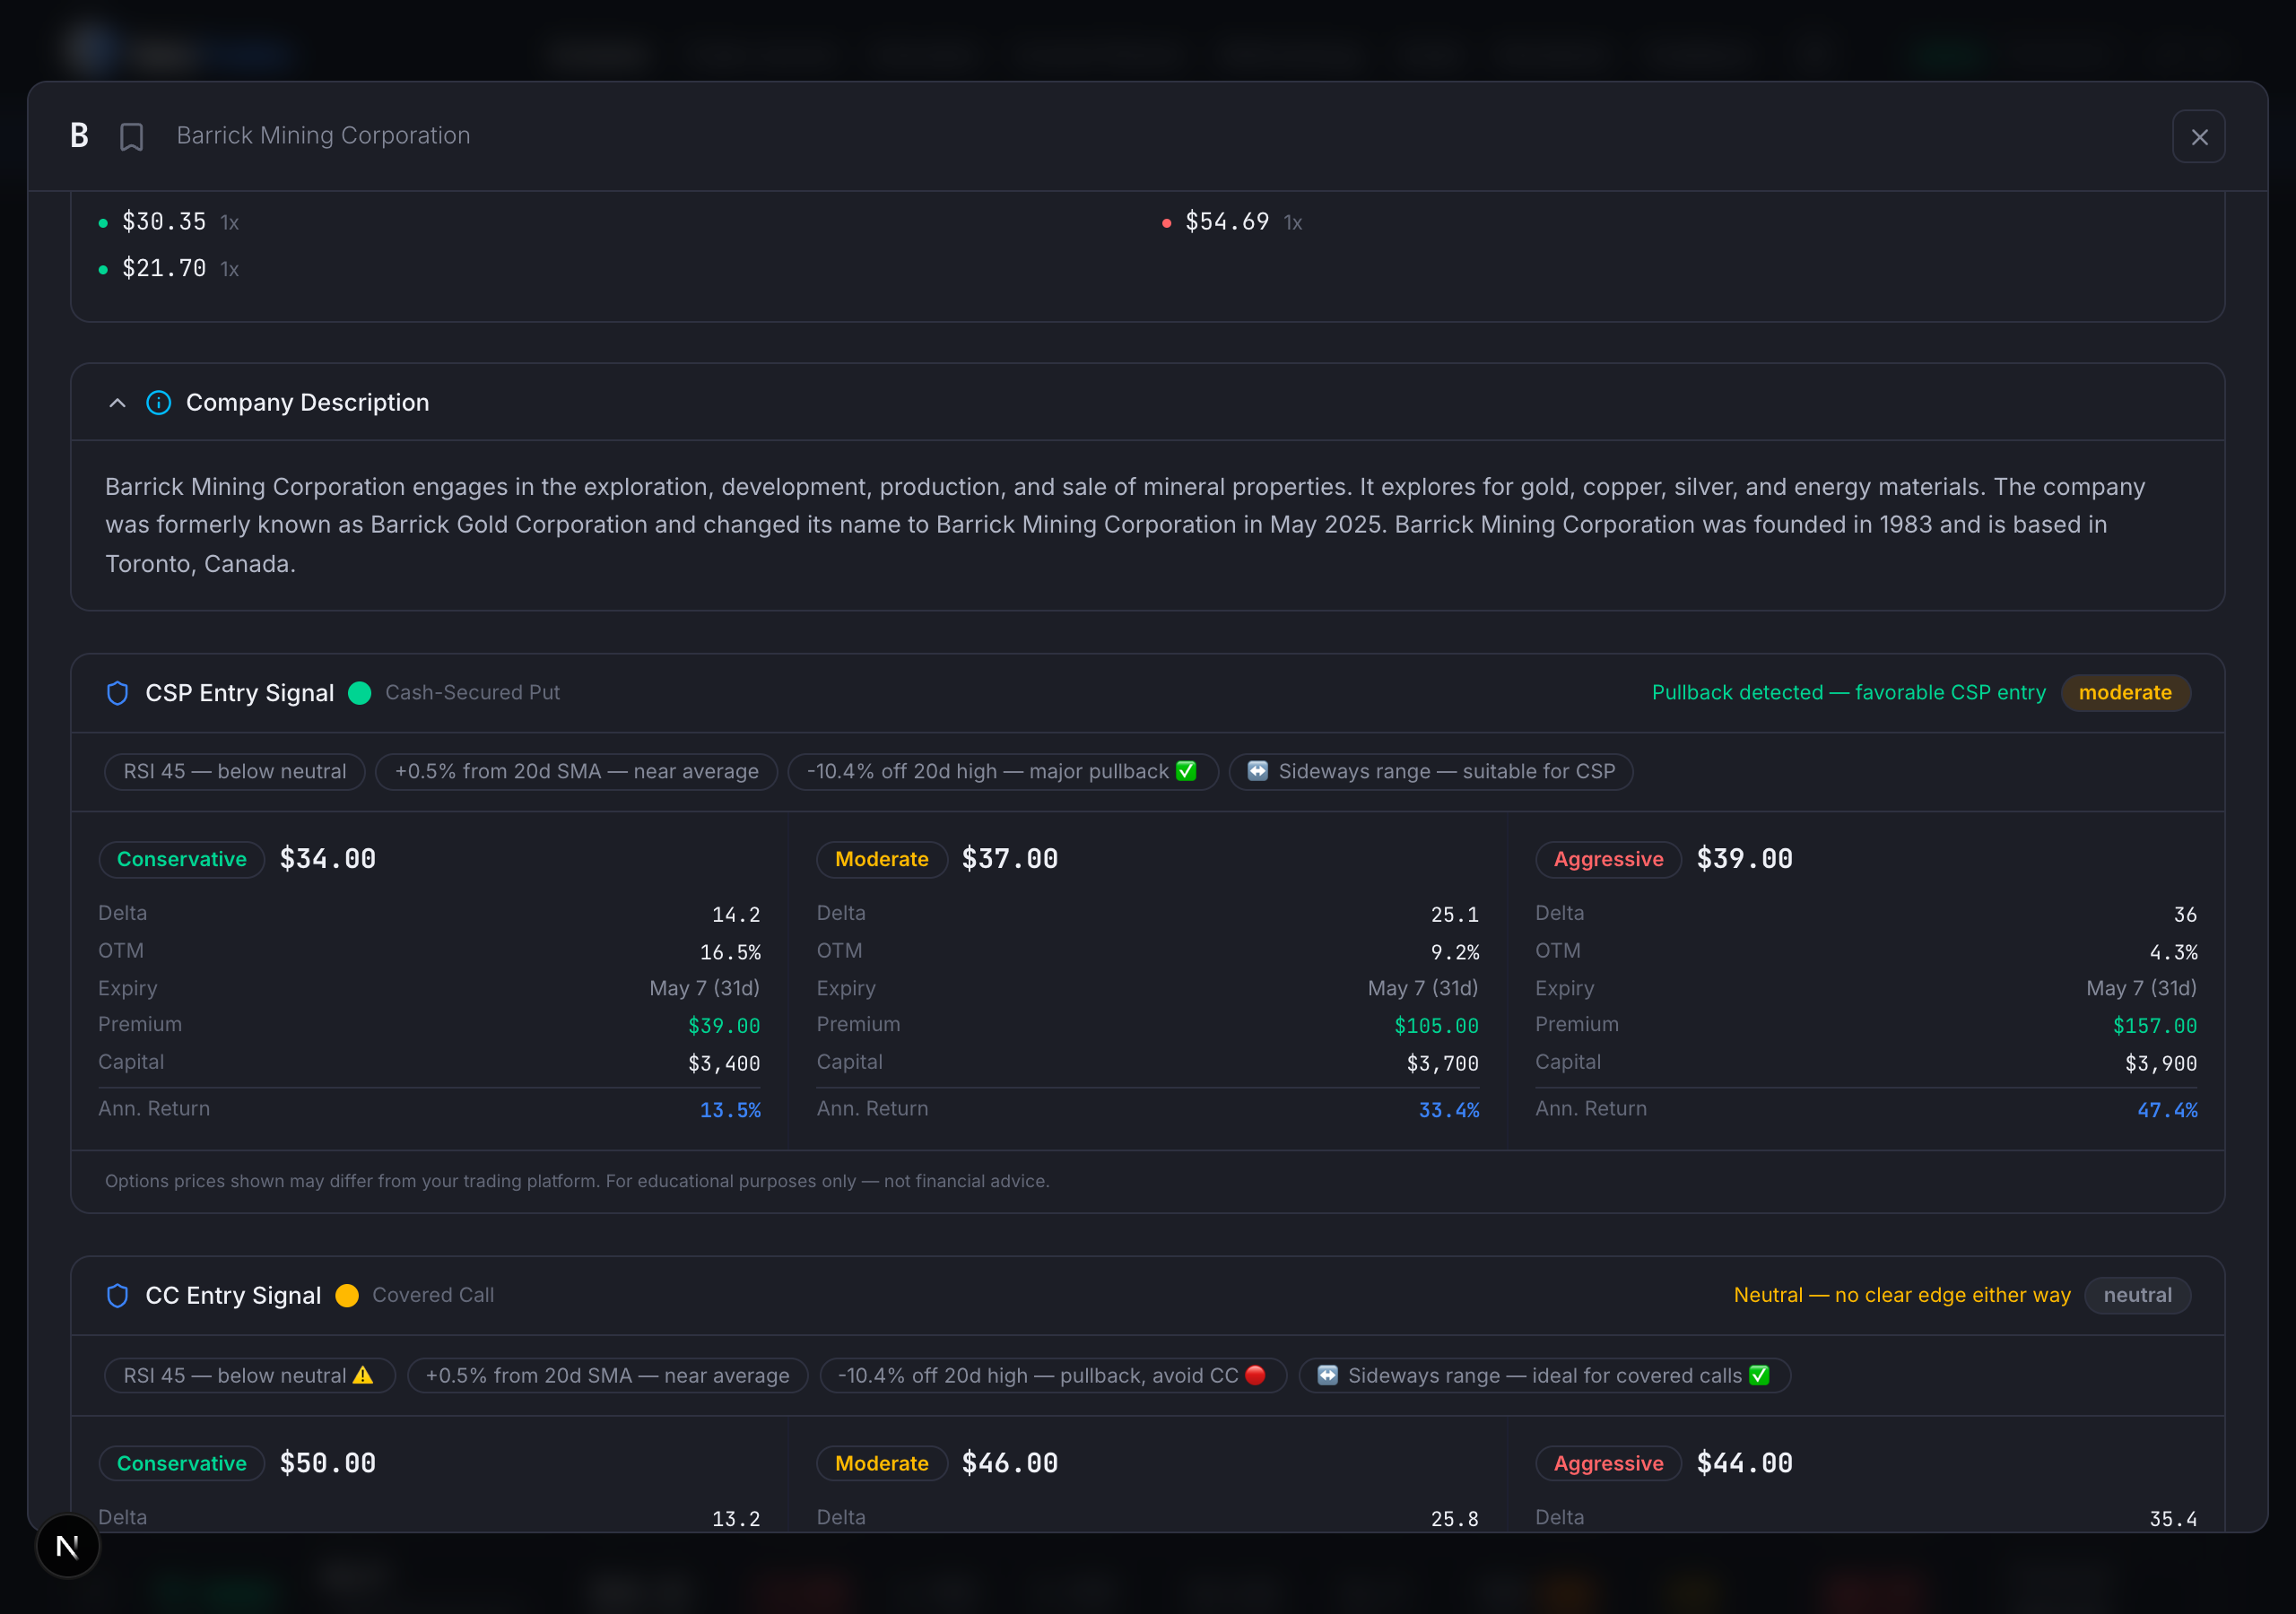
Below each signal are three strike tiers — Conservative, Balanced and Aggressive — each showing the strike, delta, OTM percentage, expiry, estimated premium, capital required and annualized return. They are reference levels spanning a risk range, not a ranked recommendation: the conservative strike trades premium for a wider cushion, the aggressive one does the reverse. Verify the live premium with your broker before acting, since quoted premiums are estimates from cached chain data.