18Retirement Planner
The Retirement Planner answers one question, year by year: does your income cover your spending? It adds up four sources — your Social Security, your spouse's, income from running the wheel, and money taken out of a traditional portfolio — and lines them up against spending that rises with inflation.
The Income Planner answers a nearer question: can you live off your wheel income right now. This one looks decades ahead, and brings Social Security into the picture.
Why the portfolio is split in two
Most retirement calculators ask for one “expected return”. That hides the thing a wheel trader most wants to see, because the two halves of your money behave differently:
- The wheel sleeve pays you in cash, from premium. That income arrives whether or not the stock moved.
- The traditional sleeve pays you by selling shares. That is the entire reason the 4% rule exists.
So you tell the planner what share of your savings runs the wheel, and each half gets its own return. Averaging them into a single number would hide which one is actually carrying your retirement.
Filling it in
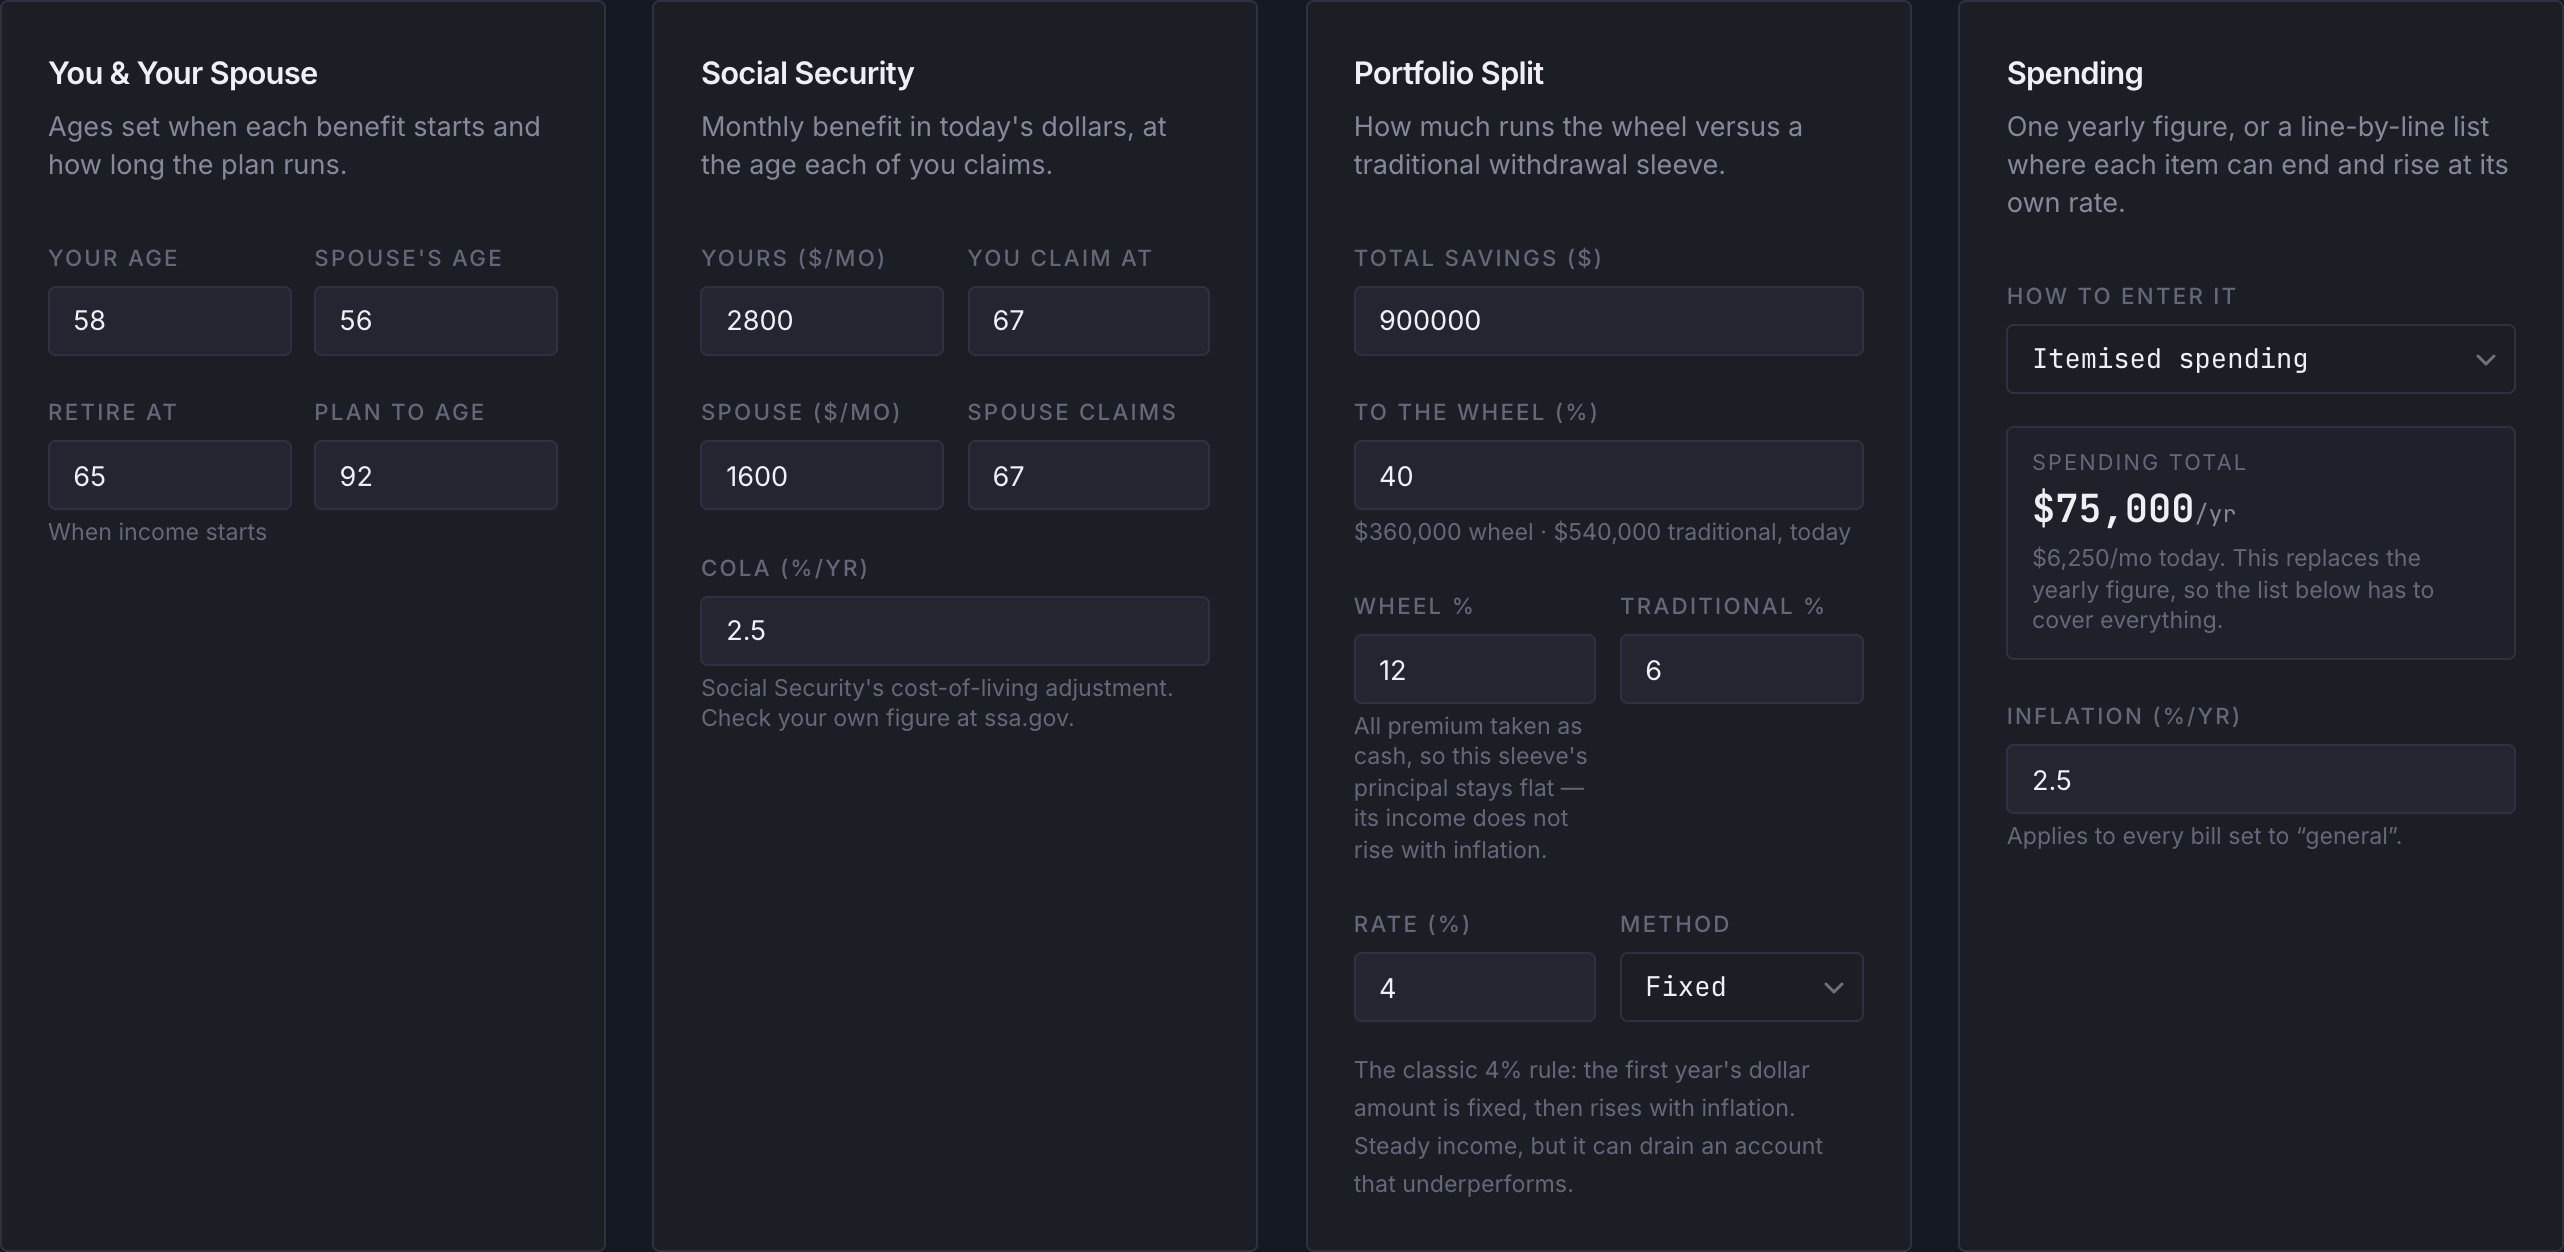
You & Your Spouse. Ages today, the age you retire (when income starts), and the age the plan runs to.
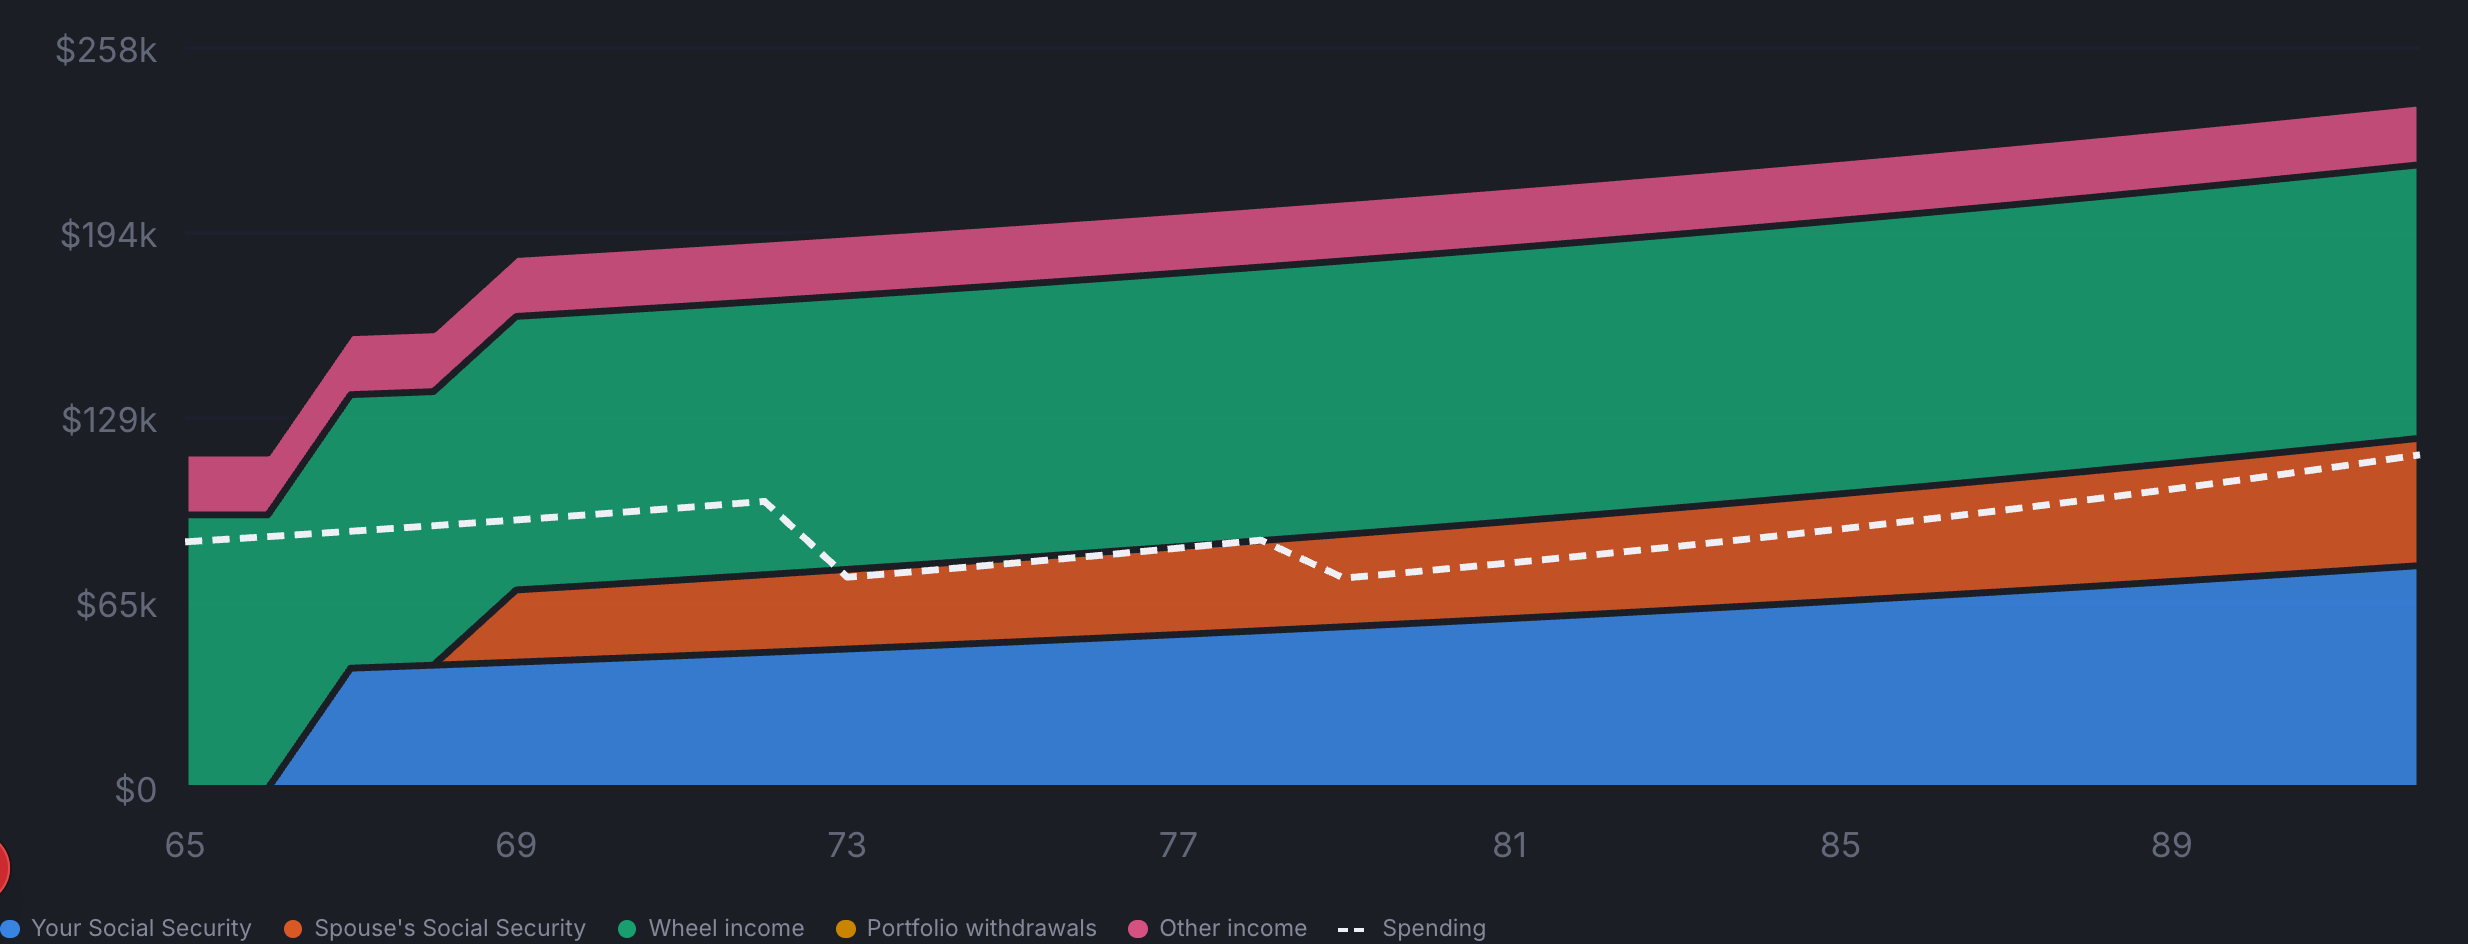
Social Security. Enter each monthly benefit in today's dollars and the age each of you claims. The planner grows both by the COLA you set, and starts each one the year that person reaches their claiming age — so a younger spouse claiming at 67 simply starts later, and you will see the step in the chart.
Portfolio Split. Your total savings, and the share of it running the wheel. Set a return for each half, then the withdrawal rate and method for the traditional side.
The two withdrawal methods are genuinely different
- Fixed is the classic 4% rule. It works out the first year's dollar amount and then raises it with inflation — it never looks at your balance again. Steady income, but it can drain an account that underperforms.
- % of balance recalculates from what is actually left every year. It can never fully empty the account, but it hands you a pay cut in every downturn.
Other income
A pension, part-time work, a rental, a trust — add as many as you have. Each one keeps its own start age, end age and inflation behaviour, because they genuinely behave differently.

- Part-time work that stops. Set a To Age of 72 and the income simply ends there.
- A pension with no raise. Set “Rises each year” to Not at all. This is the one worth modelling honestly — a fixed $2,000 a month buys steadily less every year, and watching that gap open up is the point.
Spending: one figure, or line by line
You can enter a single yearly figure, or itemise. Itemising is worth the extra minute, because bills behave differently over thirty years and one number cannot express any of it.
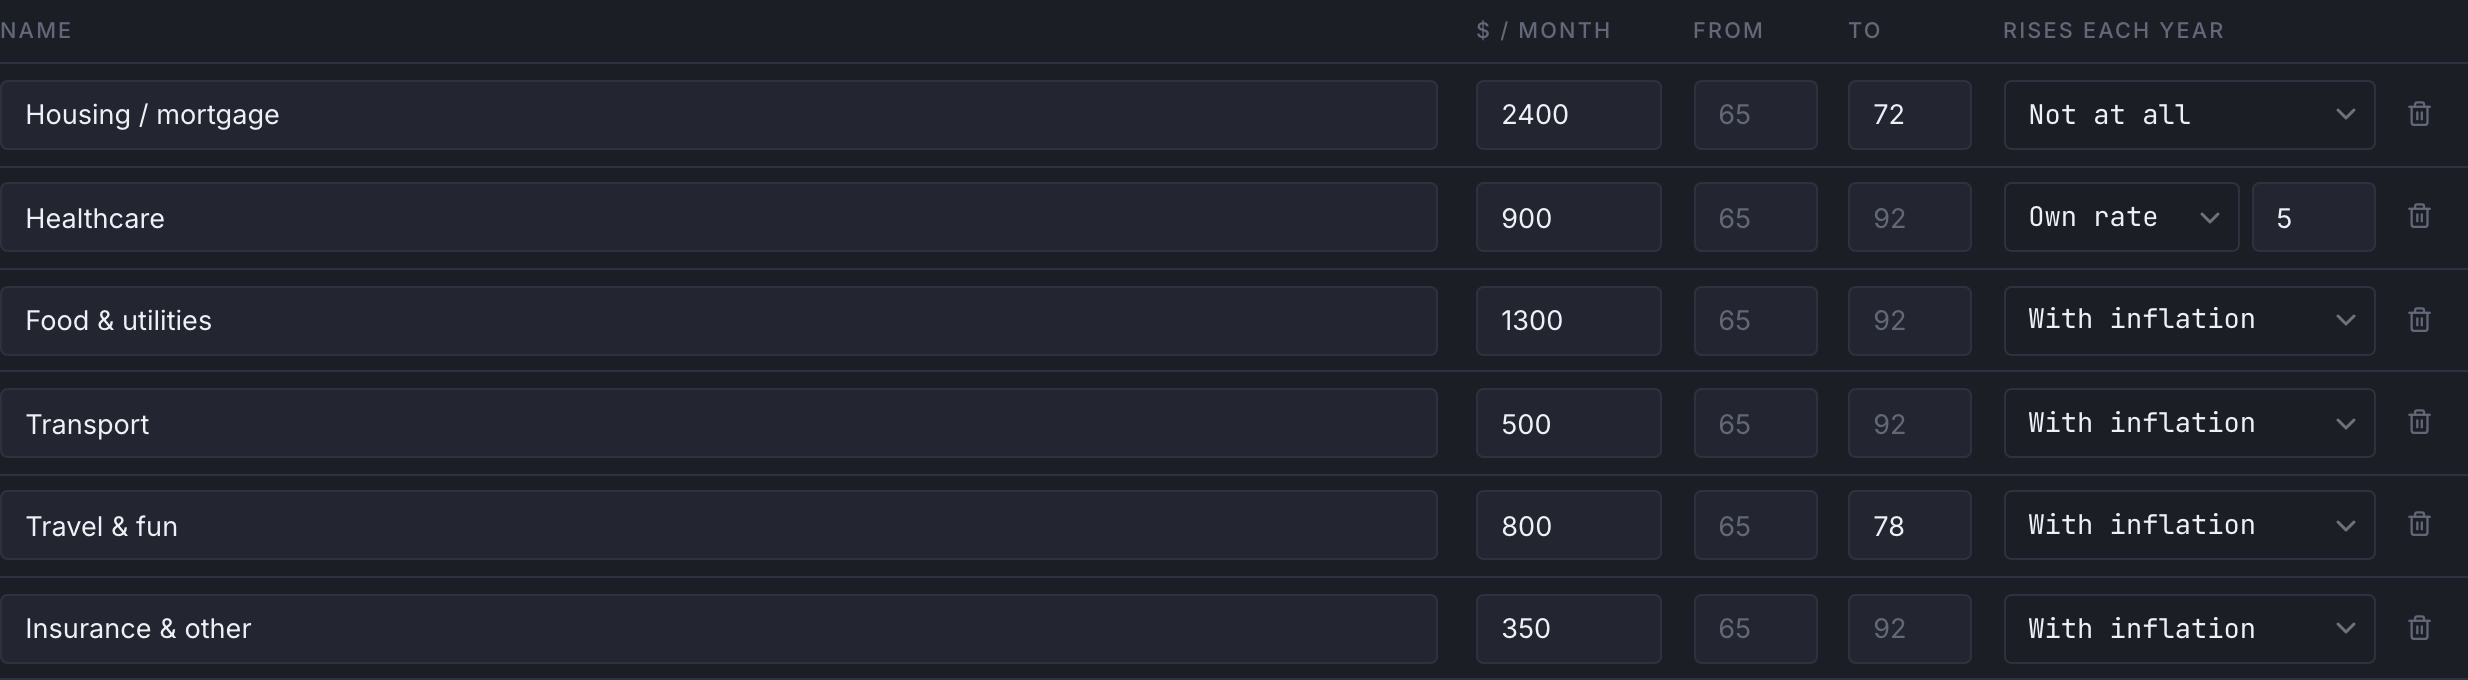
- Some stop. A mortgage paid off at 72 is a permanent step down in the income you need. That step is often the difference between a plan reading short and reading covered.
- Some rise faster. Healthcare at the same rate as groceries understates it for decades. Set it to its own rate.
- Some never rise. A fixed payment quietly shrinks against everything else.
Reading the result
The verdict at the top says whether income covers spending in every year of the plan. One short year is enough to make it read short, and it will tell you the age it first happens.

The chart stacks each year's income against the dashed spending line. Because each line can end at its own age, you can see the plan change shape — the step down below is a mortgage being paid off.

Covered Without Selling is the tile worth watching. It is the share of your first year's spending that Social Security, wheel premium and other income cover on their own — before touching the portfolio. Above 100% means nothing has to be sold that year.
Saving scenarios and exporting
Name a plan and save it — “Retire at 65”, “Retire at 68”, “If we downsize” — then switch between them from the dropdown. Everything comes back exactly as you left it, including your spending lines and income sources.
Scenarios are saved to your account, not your browser, so they are there on your phone too. Saving under a name you have already used updates that scenario rather than making a copy.
Download PDF prints the whole plan — your assumptions, the chart, and every single year, not just the summary rows shown on screen. It is built to be handed to an advisor.